
2025 Outlook for Southwest Indian Ocean Monsoon
The Southwest Indian Ocean Monsoon for 2025 is expected to be normal to slightly strong throughout the season. Based on the latest multi-model forecasts and climate indicators, monsoon onset is projected to occur on time or slightly earlier than average, likely in late May to early June. Similarly, the monsoon is expected to withdraw later than normal, potentially in the second half of September.
These seasonal characteristics are informed by our analysis of ocean-atmosphere dynamics, historical analog years, and the latest ensemble model outputs, positioning the 2025 monsoon as a potentially robust contributor to maritime weather conditions across the region.
Rainfall Outlook from IMD
The India Meteorological Department (IMD) issued its monsoon forecast in April, projecting 105% of the long-period average (LPA) rainfall for India, placing this season in the “above normal” category. The IMD forecast includes a 33% probability of above-normal rainfall and a 26% probability of excess rainfall, both figures exceeding the climatological averages for these categories.
This anticipated rainfall distribution supports expectations of an active monsoon season, particularly during July and August, when rainfall typically peaks. As rainfall amounts are closely tied to the strength and duration of monsoon winds, the IMD’s forecast aligns with our outlook for a slightly stronger-than-average season.
Wind Forecasts from Seasonal Models
Using multi-model ensemble (MME) data from early April, we evaluated surface wind anomalies across the Arabian Sea and broader Indian Ocean region. The analysis indicates that monsoon winds in June are likely to be stronger than average, especially in the western Arabian Sea. Wind anomalies are projected to normalize during July and August, before slightly strengthening again in September over the central Arabian Sea.
These forecasts suggest a vigorous onset phase, a stable mid-season, and a sustained withdrawal period — consistent with the rainfall outlook and climatological transitions seen during strong monsoon years.
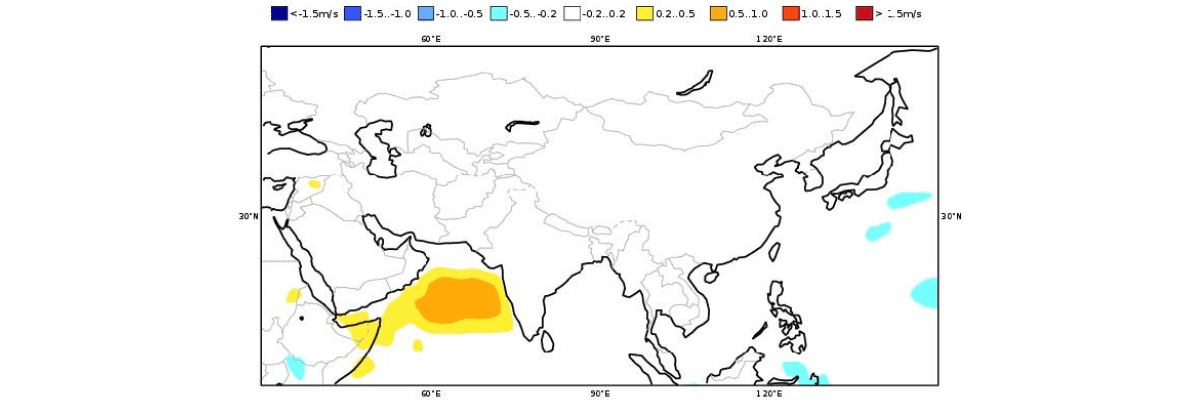
Figure 1-1: Projected 10-meter wind speed anomaly at ground level for June 2025 (Exhibit: Copernicus Climate Service (C3S) )
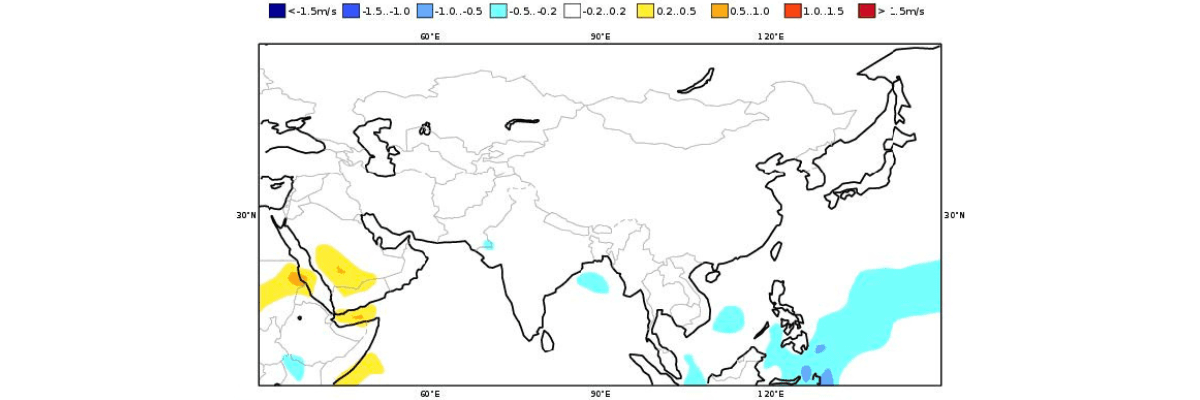
Figure 1-2: Projected 10-meter wind speed anomaly at ground level for July 2025 (Exhibit: Copernicus Climate Service (C3S) )
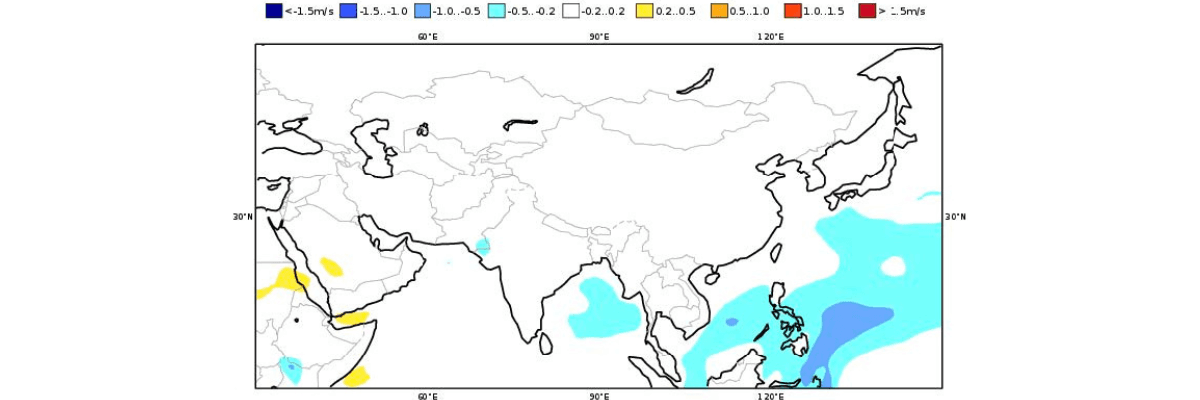
Figure 1-3: Projected 10-meter wind speed anomaly at ground level for August 2025 (Exhibit: Copernicus Climate Service (C3S) )
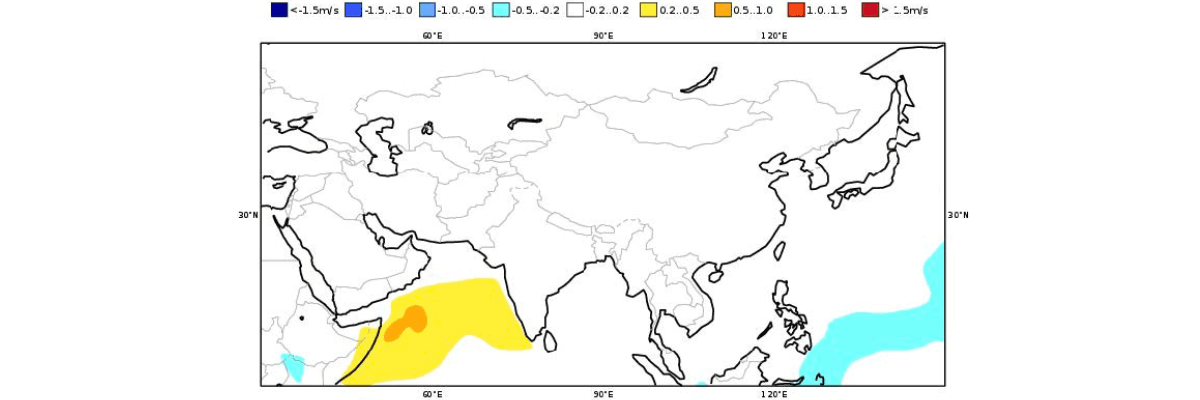
Figure 1-4: Projected 10-meter wind speed anomaly at ground level for September 2025 (Exhibit: Copernicus Climate Service (C3S) ). The forecast is slightly stronger than normal in the central Arabian Sea and southward.
Comparison with Similar Years
To further refine our forecast, we examined past years that featured similar sea surface temperature patterns and ENSO-neutral conditions: 2021, 2018, 2011, 2008, 2000, and 1996. All of these analog years produced normal to strong monsoon seasons, both in terms of wind strength and precipitation.
This historical context supports our projection of a resilient 2025 monsoon, suggesting that even without a strong ENSO signal, favorable ocean-atmosphere coupling can sustain above-average seasonal performance.
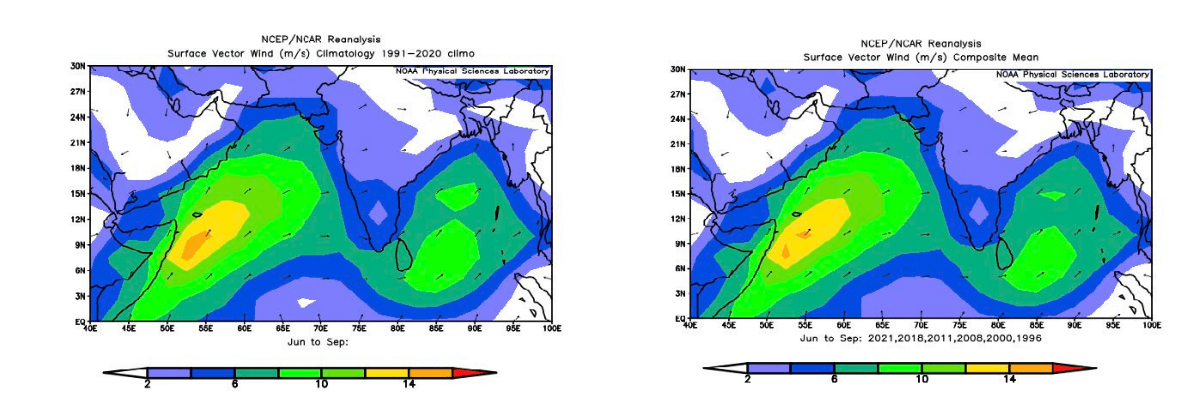
Figure 2: Distribution of monsoon wind speeds in the Indian Ocean (June-September average) for normal years (left panel) and similar years (right panel). NCEP/NCAR reanalysis data (obtained from NOAA Earth System Research Laboratory)
Key Climate Drivers Supporting the Forecast
Sea Surface Temperatures (SSTs)
Forecast models indicate that SSTs across the western and central Indian Ocean will remain slightly above normal from June to September. Warmer ocean waters enhance convection and latent heat release, promoting stronger monsoon circulations by reducing surface pressure over the ocean and increasing the land-sea thermal gradient.
This thermal contrast between ocean and adjacent landmasses is a critical driver for establishing and maintaining the monsoon flow.
Sea Level Pressure (SLP)
Seasonal forecasts suggest normal to slightly lower SLP over the Indian Ocean basin and adjacent land regions. A lower-than-average pressure gradient facilitates enhanced cross-equatorial flow and strengthens southwesterly monsoon winds, especially during the onset and retreat phases.
This pressure pattern is consistent with the expected early onset and sustained momentum through late September.
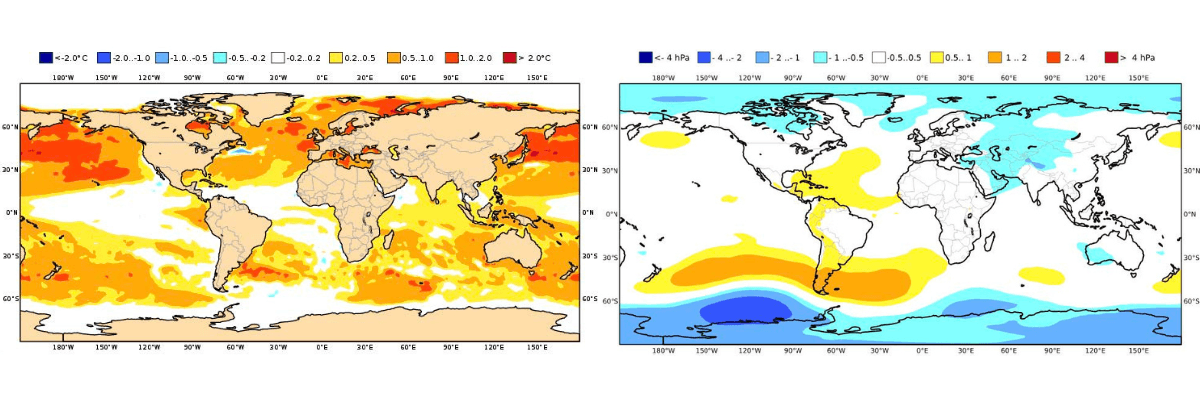
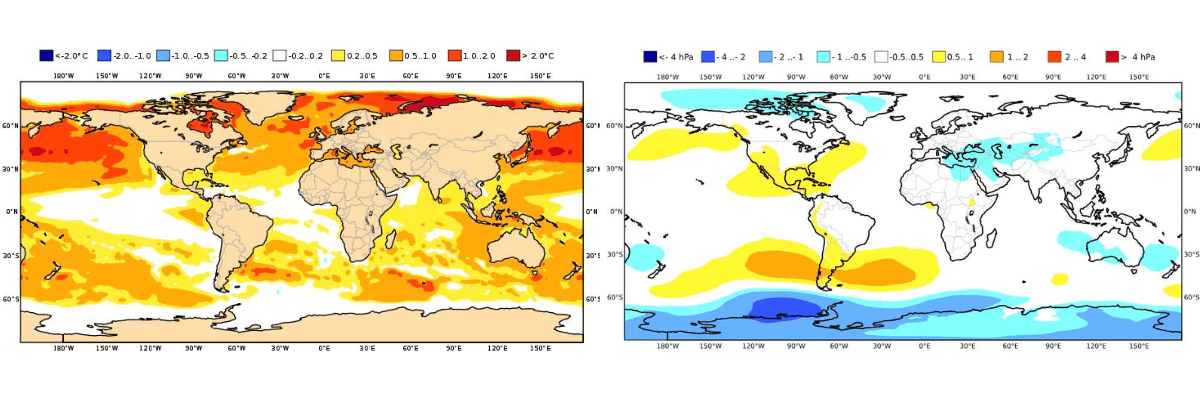
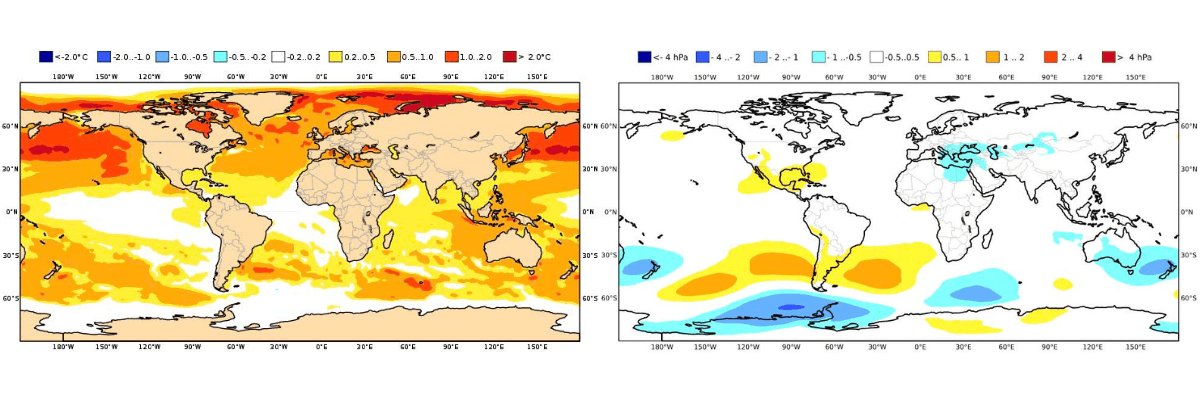
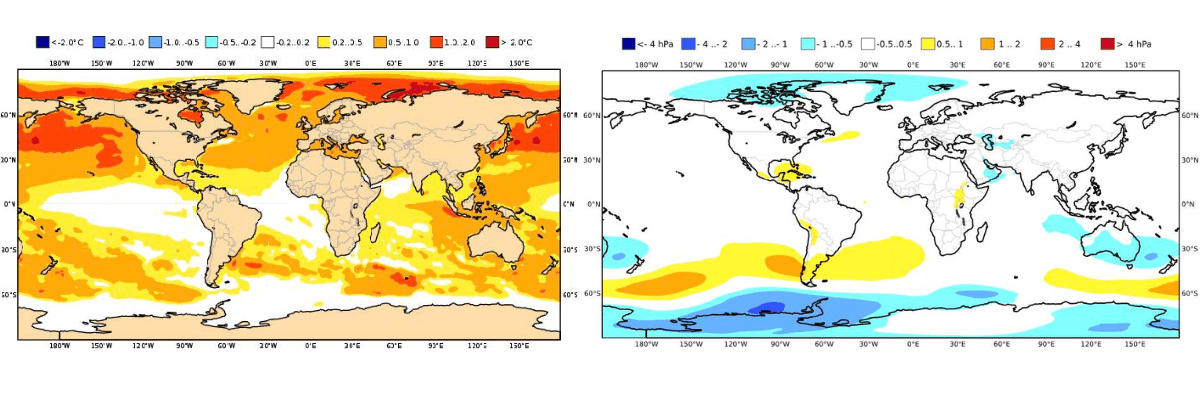
Figure 3(Left) & Figure 4(Right): Sea surface temperature anomaly forecast for June-September 2025(Left). Sea surface pressure anomaly forecast for June-September 2025(Right). (Exhibit: Copernicus Climate Change Services (C3S) )
ENSO Conditions
The ENSO cycle is currently in a neutral phase, and this state is likely to continue through the core monsoon months. While ENSO-neutral years can still exhibit variability, they often allow other regional factors to dominate — such as the Indian Ocean Dipole (IOD) or West Indian Ocean warming.
In the absence of a strong El Niño or La Niña, local dynamics — including SSTs, pressure fields, and snow cover — gain greater predictive weight.
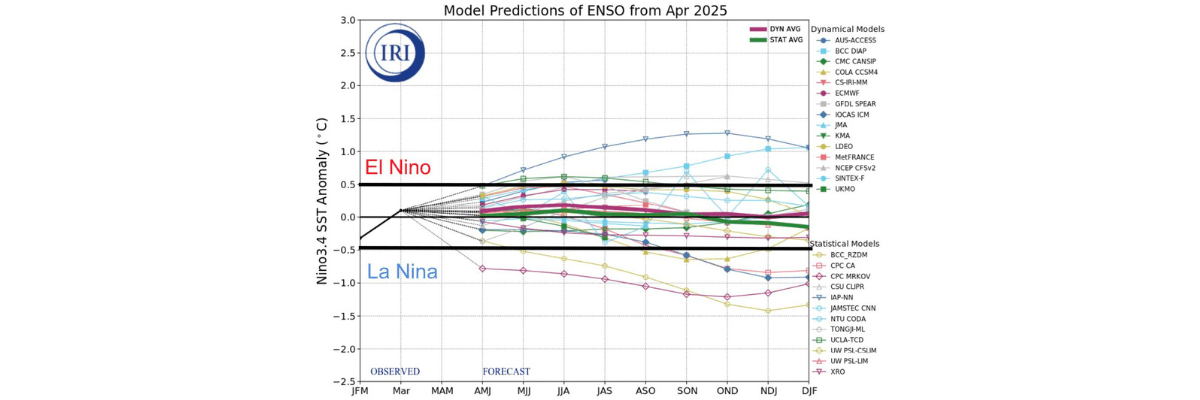
Figure 5: SST anomaly forecasts for the El Niño monitoring area based on country models (IRI summary). Water temperature anomalies of +0.5°C or greater indicate an El Niño event, while water temperature anomalies of -0.5°C or less indicate a La Niña event. Neutral conditions are expected throughout the season.
Eurasian Snow Cover
Snow cover across the Eurasian and Himalayan regions was consistently below normal during the critical pre-monsoon months of January through March. Reduced snowpack accelerates land heating in spring, enhancing the north-south thermal gradient between the Indian subcontinent and the equatorial ocean.
This in turn encourages stronger monsoon flow and supports both early onset and increased rainfall potential during the early phase of the season.
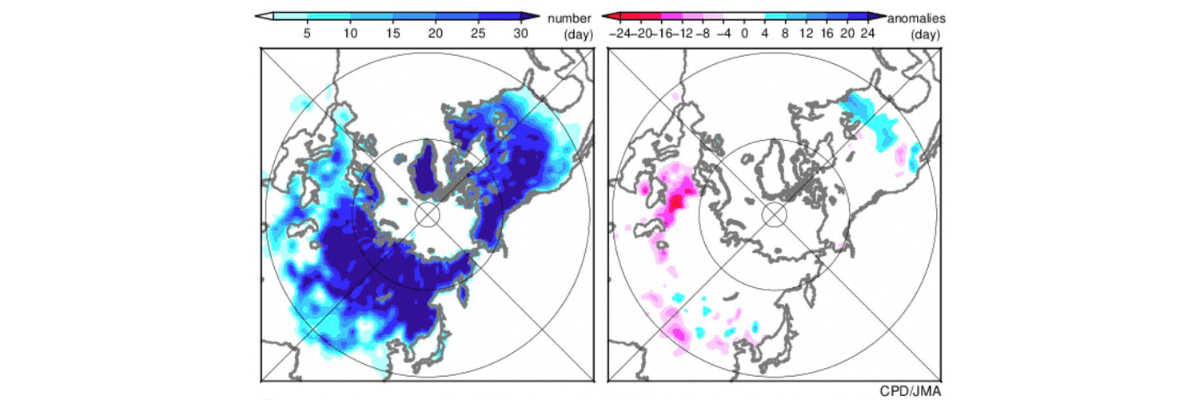
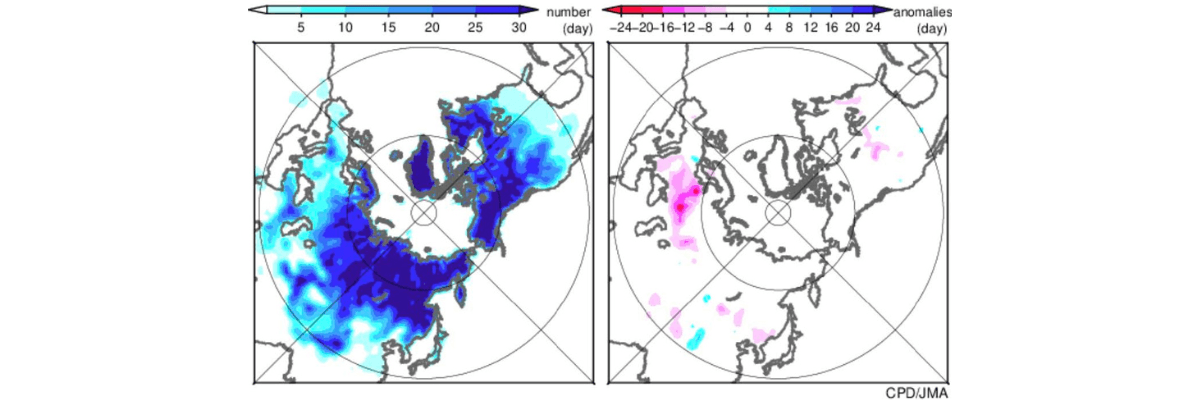
Figure 6: Snow cover duration over the Northern Hemisphere (left/days, right/anomaly) (Exhibit: Japan Meteorological Agency). The snow cover area over the Northern Hemisphere and Eurasia from January to March 2025 was smaller than normal.
Monsoon Onset Outlook
Analysis of land surface conditions in Iran, the Arabian Peninsula, and northern India shows significantly drier soils and warmer ground temperatures in April and May. This leads to rapid land heating, a crucial precondition for the development of monsoon pressure gradients.
At the same time, sea surface temperatures in the Arabian Sea were higher than usual in May, reinforcing the land-sea contrast. These combined factors make it likely that the monsoon will commence on time or slightly ahead of schedule — most likely in the final week of May or early June.
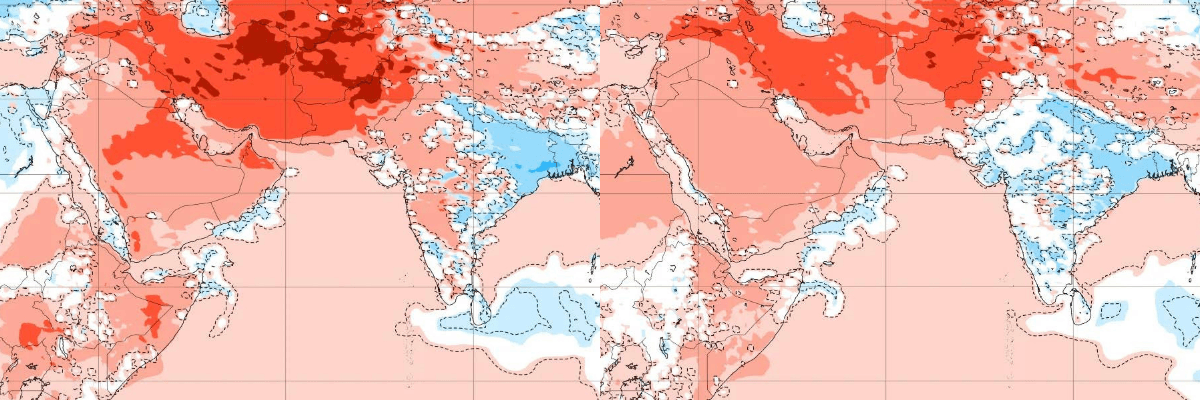
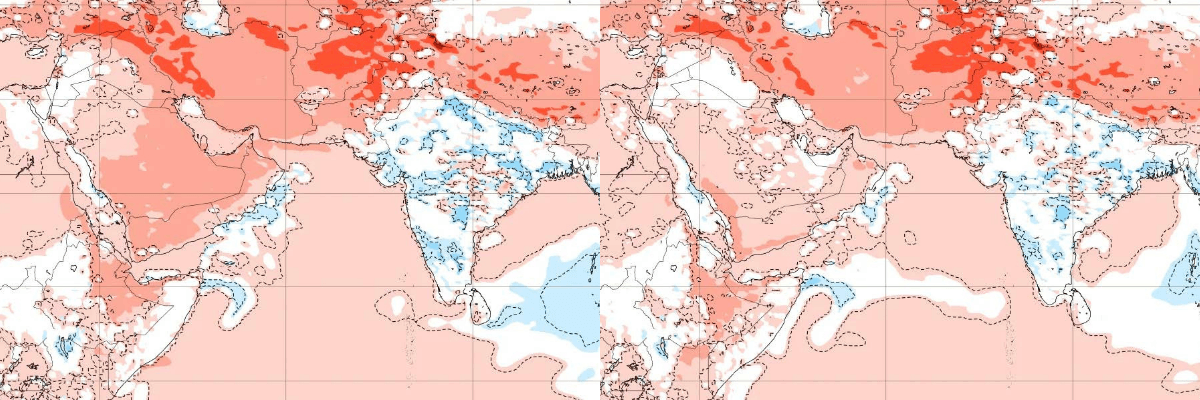
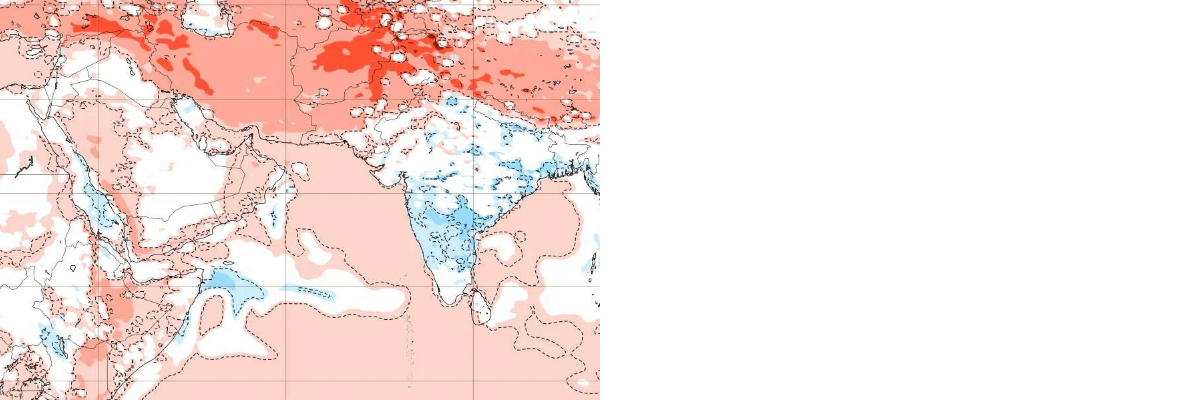
Figure 7: Surface temperature anomaly forecast for May 2025 based on the extended forecast model (Exhibit: ECMWF) Until mid-May, sea surface temperatures in the Arabian Sea have areas that are lower than normal in the west, but are generally high. Subsequently, towards the beginning of June, the northern Arabian Sea is expected to be higher than normal, while the southern part will be normal. Meanwhile, the Middle East is predicted to be higher to considerably higher than normal. In India, there are areas in the west with higher than normal temperatures around early May, but thereafter, temperatures are expected to be normal to lower than normal. Based on the above, May indicates a normal to larger than normal sea-land surface temperature difference, suggesting that the onset of the monsoon may be normal or early.
Monsoon Withdrawal Outlook
Seasonal models indicate that lower-than-normal sea level pressure may persist into September, especially over northern India and the Bay of Bengal. This pattern historically delays the weakening of monsoon winds and postpones the retreat of rainfall.
Based on this, we forecast that the withdrawal of the 2025 monsoon will likely occur in the second half of September, later than the climatological norm.
Looking Back at the 2024 Monsoon
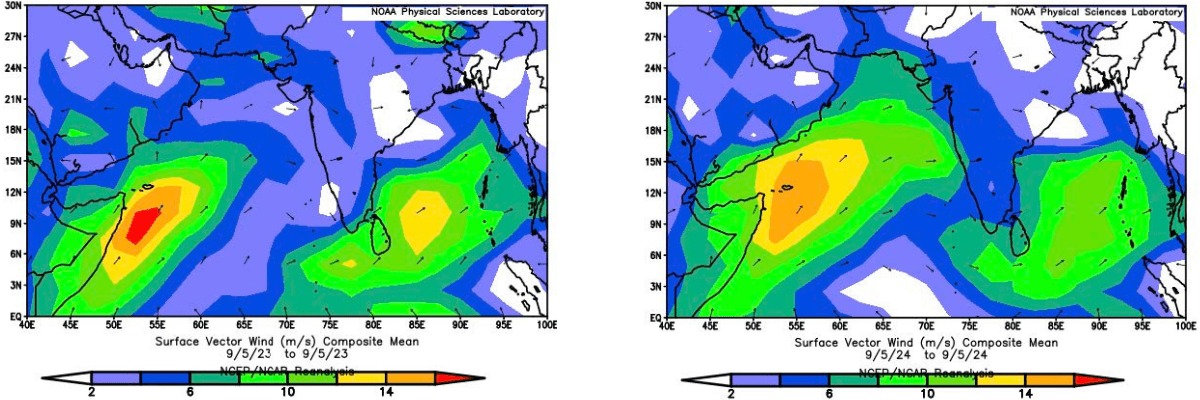
The 2024 Southwest Indian Ocean Monsoon was stronger than average, beginning on May 30 (two days earlier than normal) and concluding on September 23 (six days later than average). Total rainfall for the Indian subcontinent reached 108% of the long-period average.
Rainfall was below normal in June, but rose above normal in July, August, and September, contributing to favorable conditions for maritime operations across the region. Wind anomalies were particularly noticeable in July and September, aligning closely with this year’s seasonal model projections.
Reference Climatology and Past Trends
Shown is the distribution of monsoon wind speeds over the Indian Ocean from May to September. (Left/1991-2020 average, Right/2024)
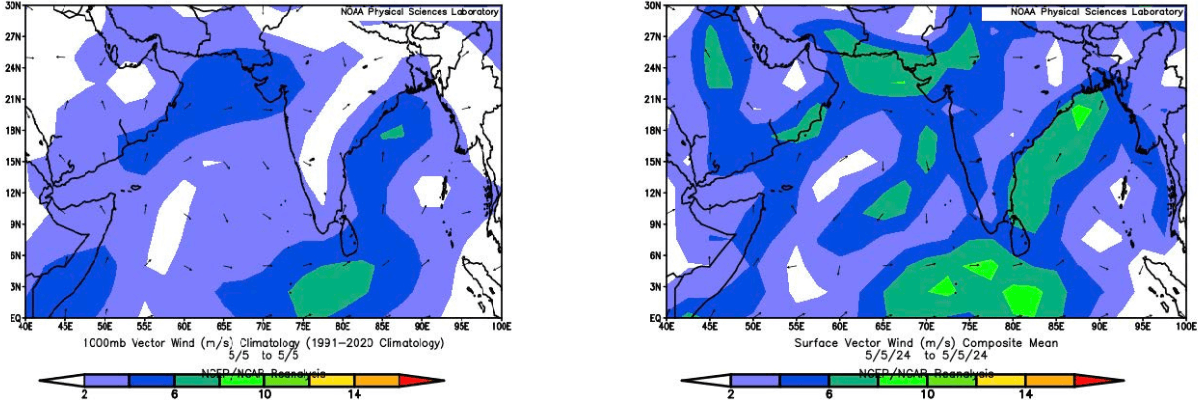
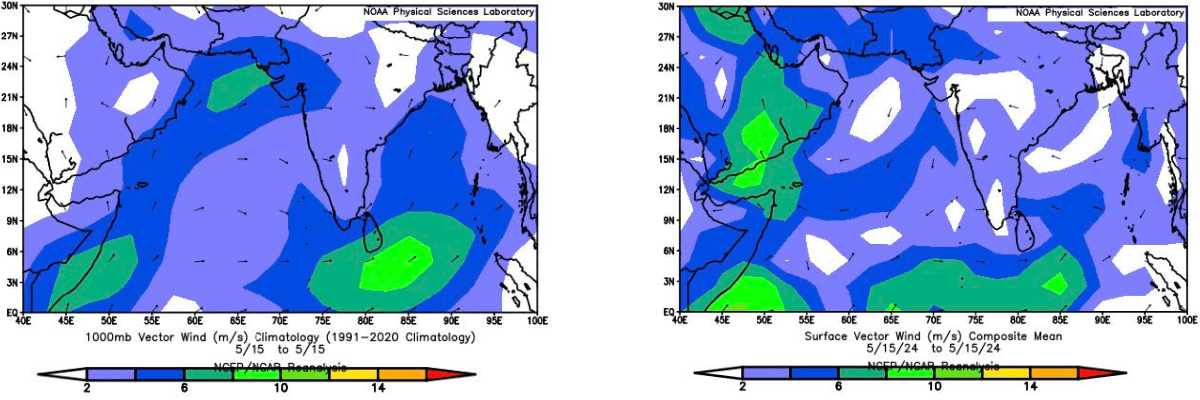
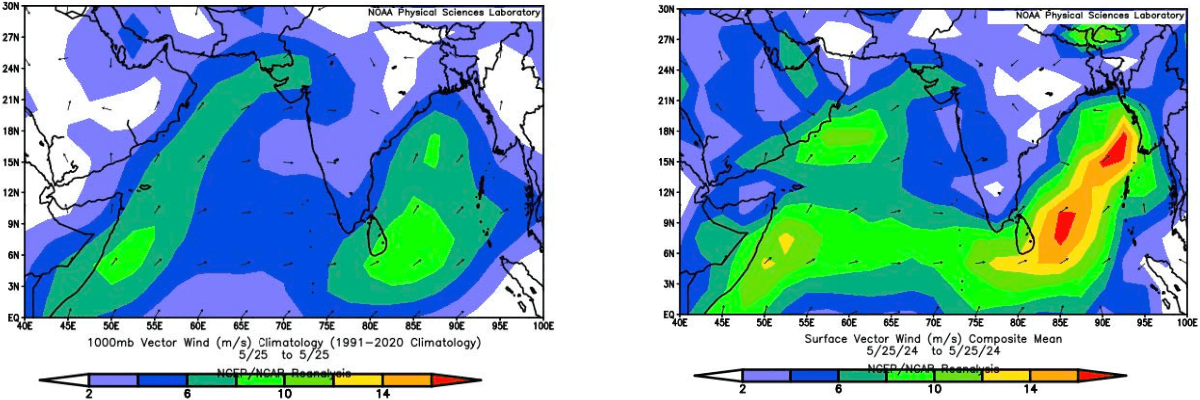
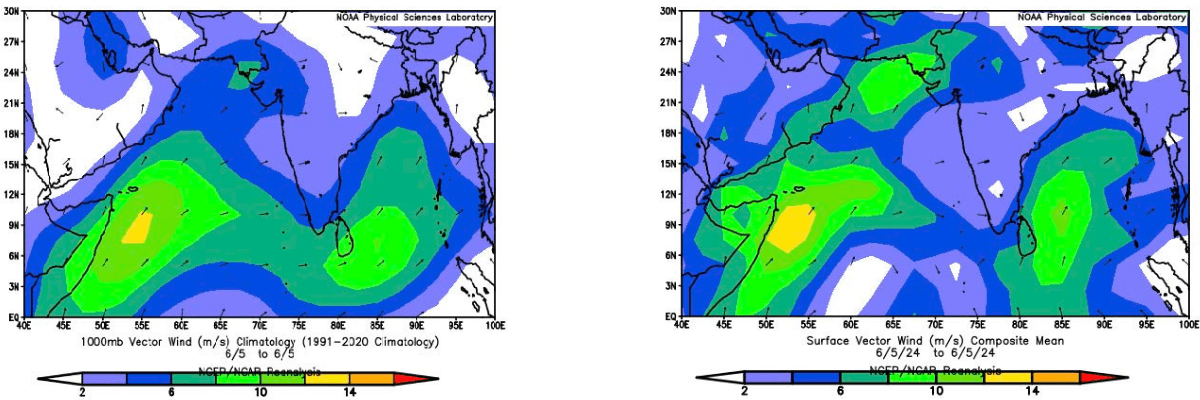
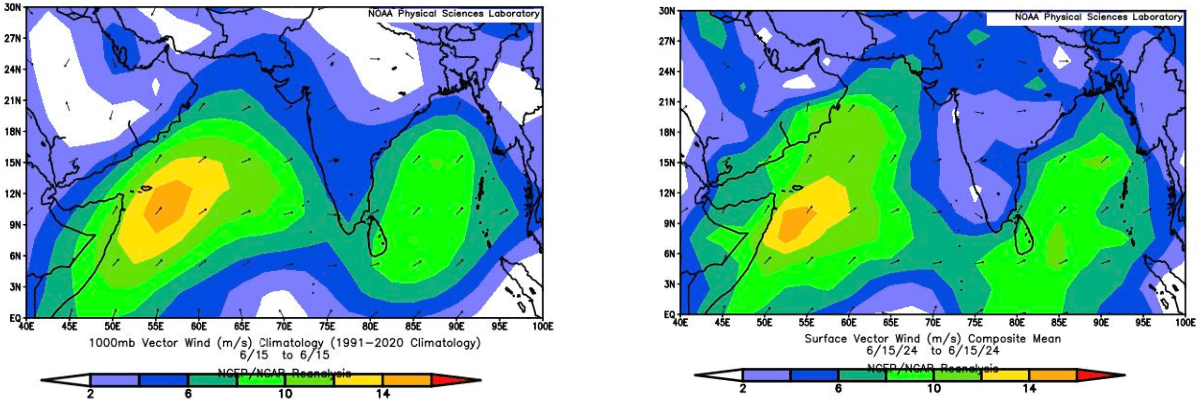
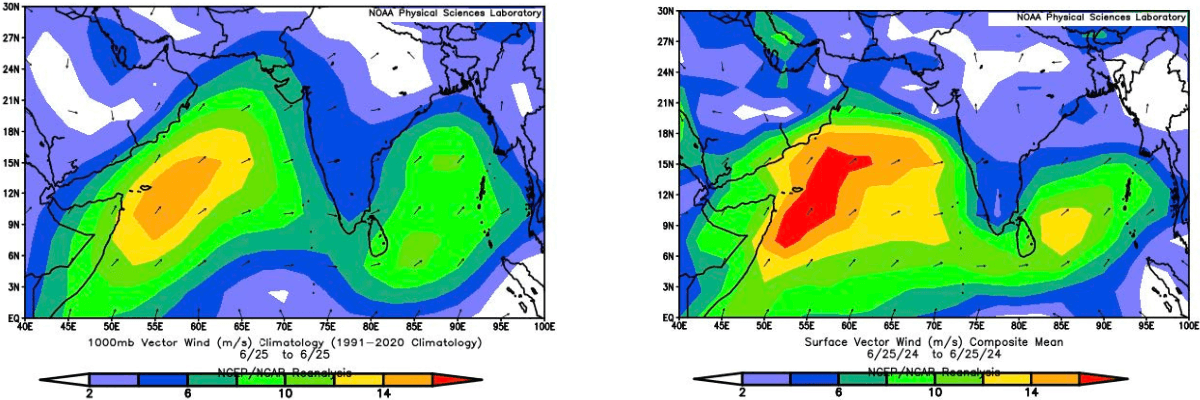
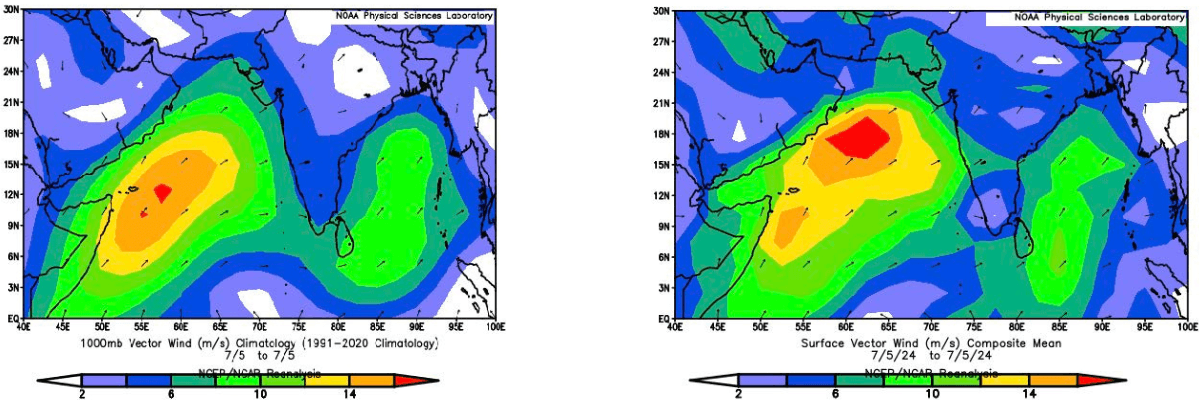
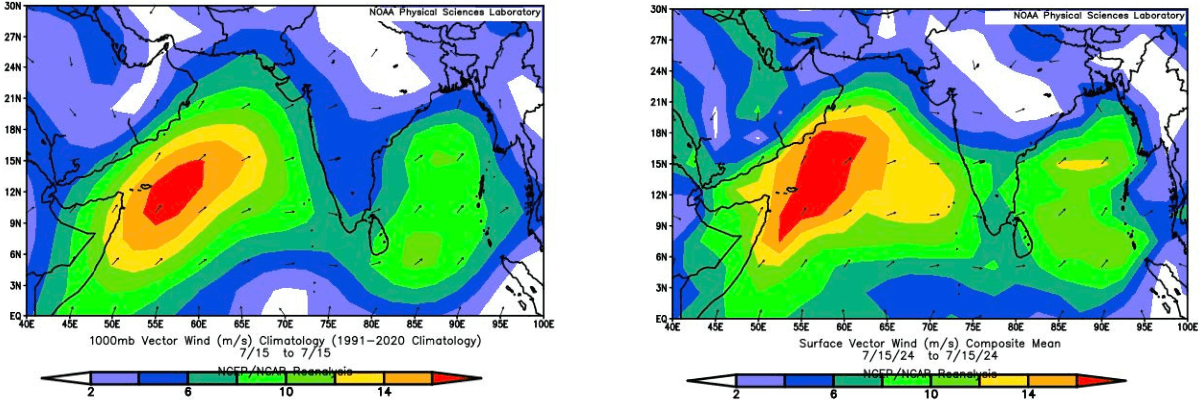
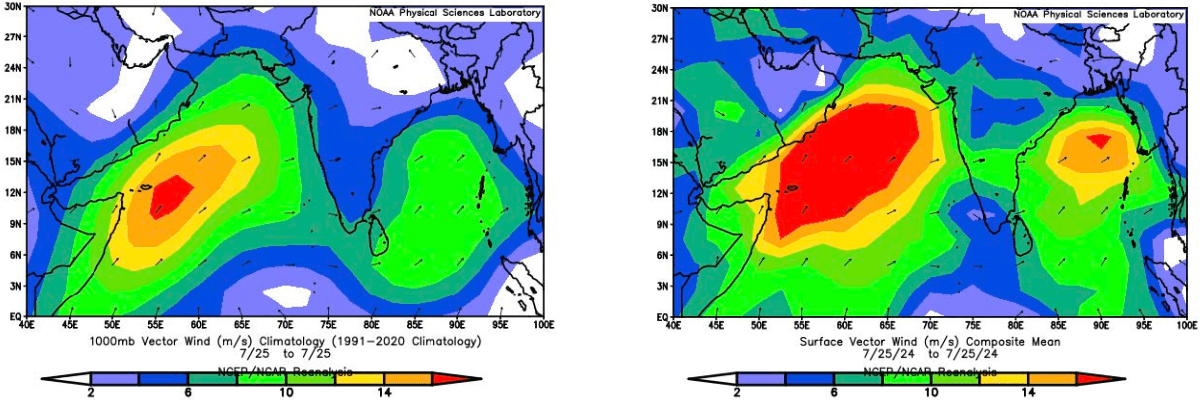
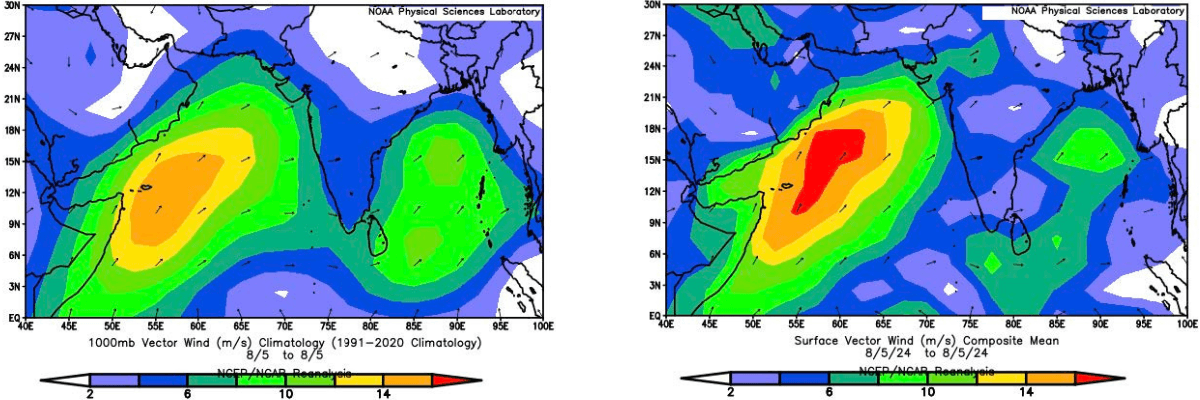
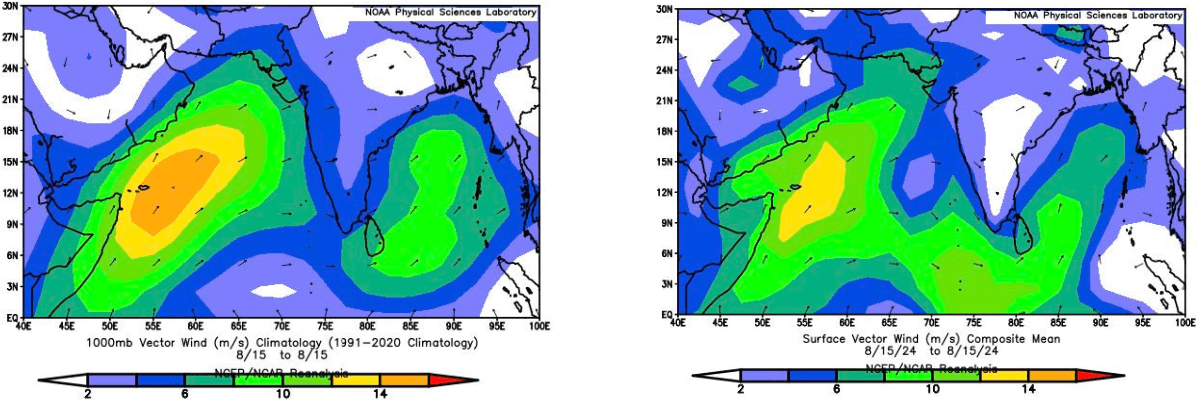
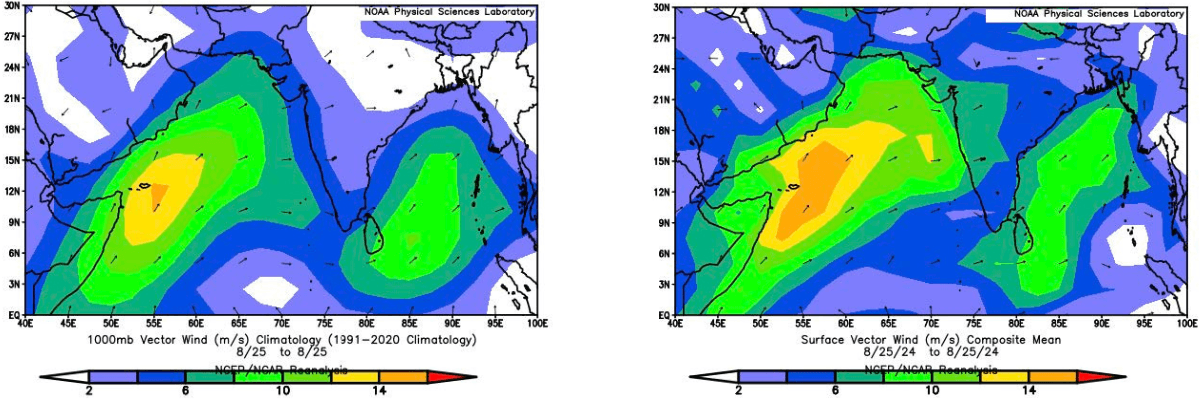
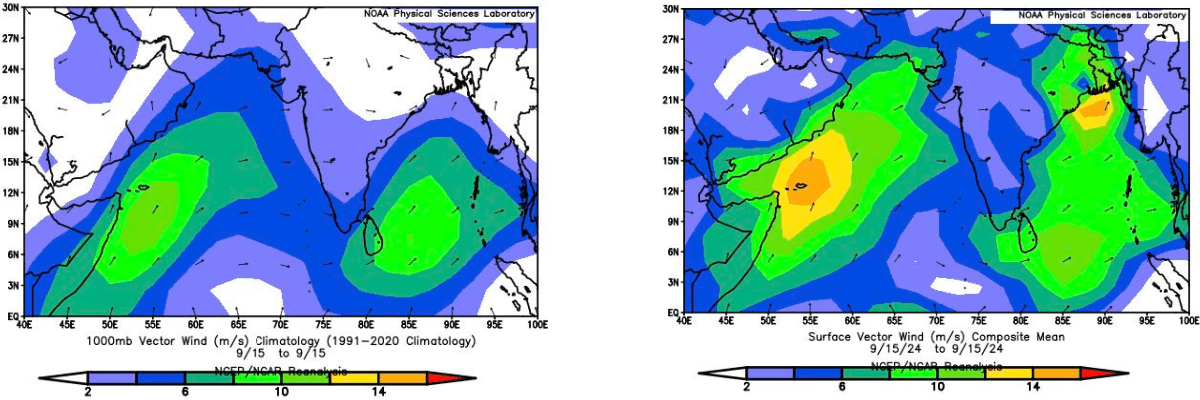
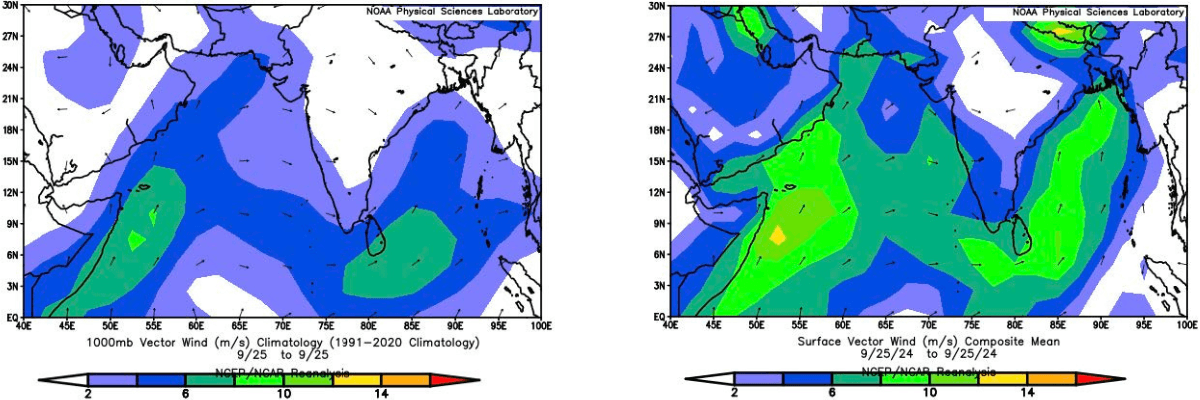
Legend: Average daily wind speed