Tropical Storm Season Outlook – North Atlantic & Northeast Pacific (2025)
Tropical storm activity in both the North Atlantic and Northeast Pacific is forecast to trend near average for the 2025 season, with variations between early and late periods. Weathernews’ latest analysis identifies key atmospheric and oceanic patterns that will shape storm development across both basins from June through November.
1. North Atlantic Outlook
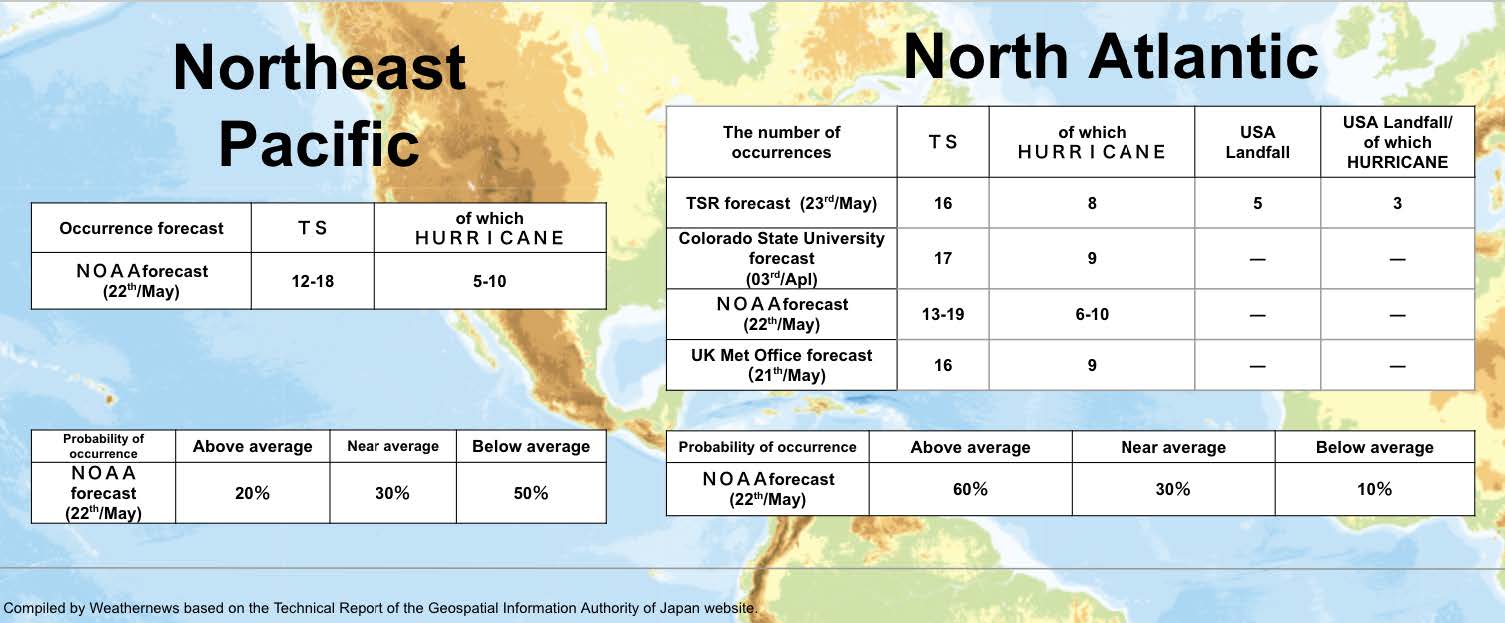
For the North Atlantic, Weathernews forecasts around 16 to 17 tropical storms or hurricanes this season, which is considered slightly above average by our classification. Activity during the early season (June to August) is expected to be slightly more active than usual. This trend is also projected to continue into the late season (September to November).
Atmospheric conditions influencing this include slightly weaker-than-usual convective activity, but vertical wind shear is also expected to be lower than normal. This reduction in shear may provide a more favorable environment for storm development.
2. Northeast Pacific Outlook
The Northeast Pacific is also forecast to experience around 15 to 17 tropical storms or hurricanes, close to the seasonal average. However, this region shows more variation between the first and second halves of the season. Slightly below-average activity is anticipated from June to August, while a slight increase is expected from September to November.
This early-season decrease is linked to weaker convective activity due to subsiding air from the western Pacific. Vertical wind shear is also forecast to be slightly stronger than normal, which may further suppress storm formation during this period. In contrast, the late season should see a return to near-normal convective patterns and slightly reduced wind shear, supporting a modest uptick in storm occurrences.
Atmospheric & Oceanic Conditions Behind the Forecast
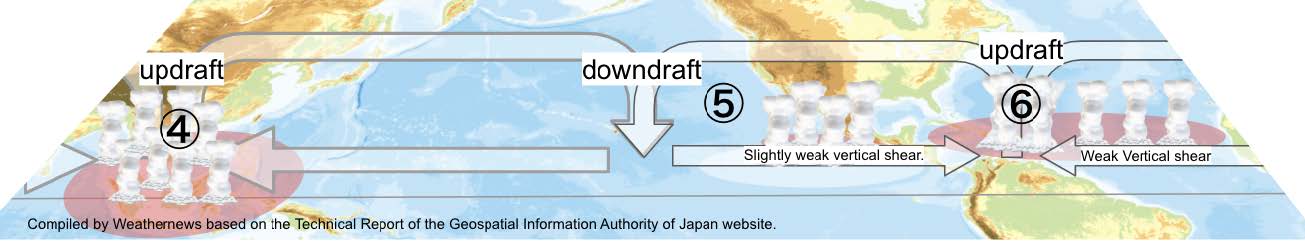
Early Season (June–August)
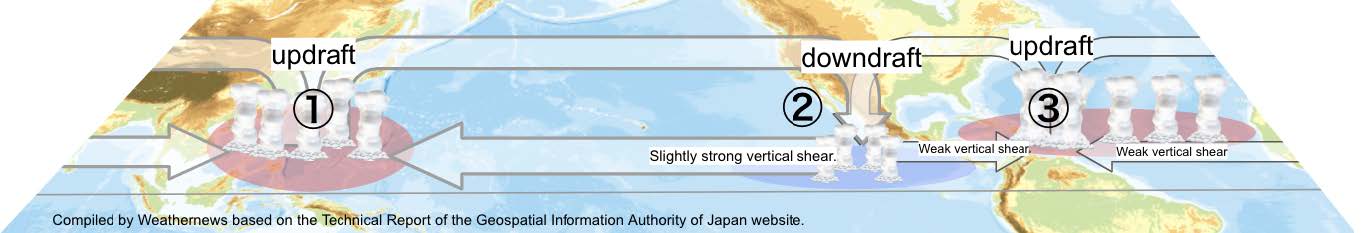
Convective activity near the Philippines is forecast to be near average but positioned farther north and west than usual. As a result, the rising air in this region descends over the tropical storm/hurricane generation area of the Northeast Pacific. This suppresses convective activity, making it slightly less active than usual. Vertical wind shear, the difference in wind speed and direction between the lower and upper atmosphere, is also expected to be slightly stronger than normal, which further reduces the likelihood of tropical storm or hurricane formation in this basin.
In contrast, the North Atlantic is expected to experience slightly weaker-than-average convective activity. However, vertical wind shear is forecast to be lower than usual. This creates a more favorable environment for storm development, making tropical storms and hurricanes slightly more likely to form than average.
Late Season (September–November)
Convective activity over the Bay of Bengal is expected to increase more than usual. This causes the zone of rising air to shift westward compared to the early season. As a result, the descending air over the Northeast Pacific also shifts westward, allowing convective activity to return to near-normal levels. Vertical wind shear is expected to ease slightly compared to earlier in the season, making conditions moderately more favorable for storm formation.
Meanwhile, the North Atlantic continues to show slightly weaker-than-usual convective activity. However, vertical shear remains lower than normal, so conditions stay conducive for tropical storms and hurricanes to occur slightly more often than average.
Reference Years and Historical Patterns
This year’s atmospheric setup closely resembles the seasons of 2017, 2013, 2011, and 2001, based on similarities in sea surface temperature anomalies and atmospheric circulation patterns across the El Niño monitoring region, the North Atlantic, and the Northeast Pacific.
In those years, the number of tropical storms and hurricanes in the North Atlantic ranged from 13 to 18, with an average of 15.8, classified as slightly above average. The Northeast Pacific saw between 11 and 20 occurrences, averaging 16.5, classified as near average.
Monthly trends from these years suggest the North Atlantic may experience slightly reduced activity in September, despite normal levels in August and October. The Northeast Pacific tends to show reduced activity from July through September compared to the 10-year average.
1. North Atlantic
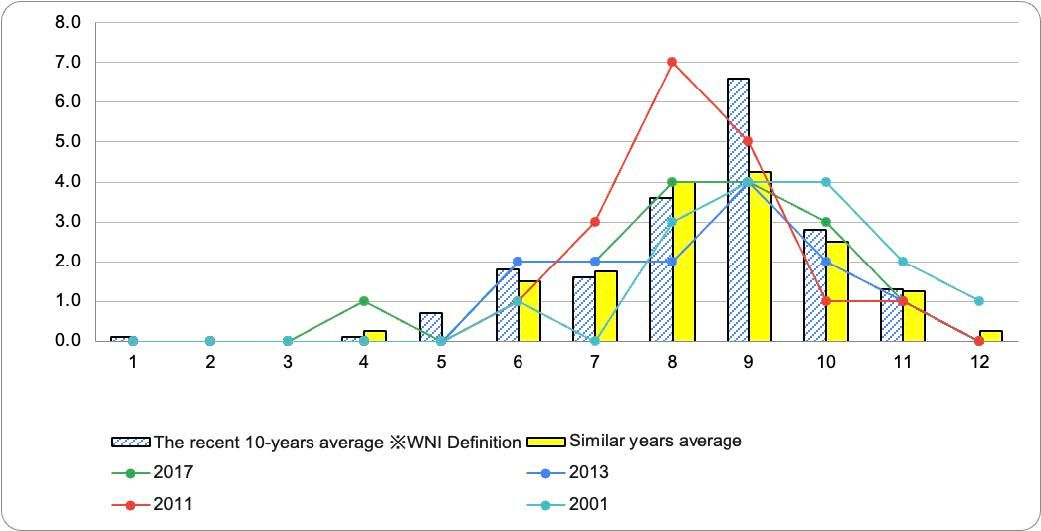
- The number of occurrences over the past 10 years has been 18.6, which is about 4 more than average.
2. Northeast Pacific
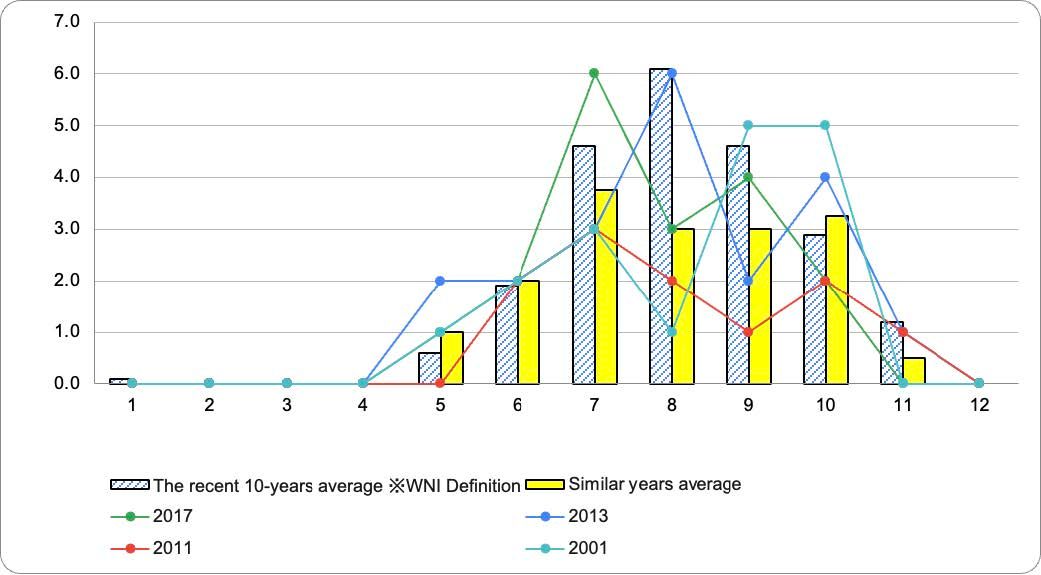
- The number of occurrences over the past 10 years has been 22.0, which is about 6 more than average.
Storm Tracks and Development Regions
No significant deviations from recent 10-year patterns are expected in terms of storm development locations or track trends in either the North Atlantic or Northeast Pacific basins.
1. North Atlantic
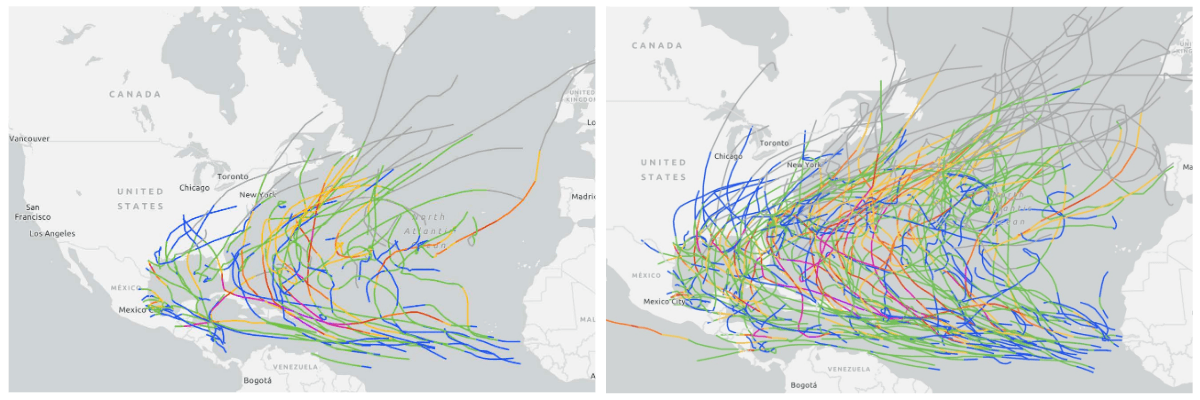
- Track maps of TS/HURRICANES that occurred in similar years (2017, 2013, 2011, 2001) (left) and track maps of TS/HURRICANES that occurred in the last 10 years (2015-2024) (right) (Source: NOAA)
2. Northeast Pacific
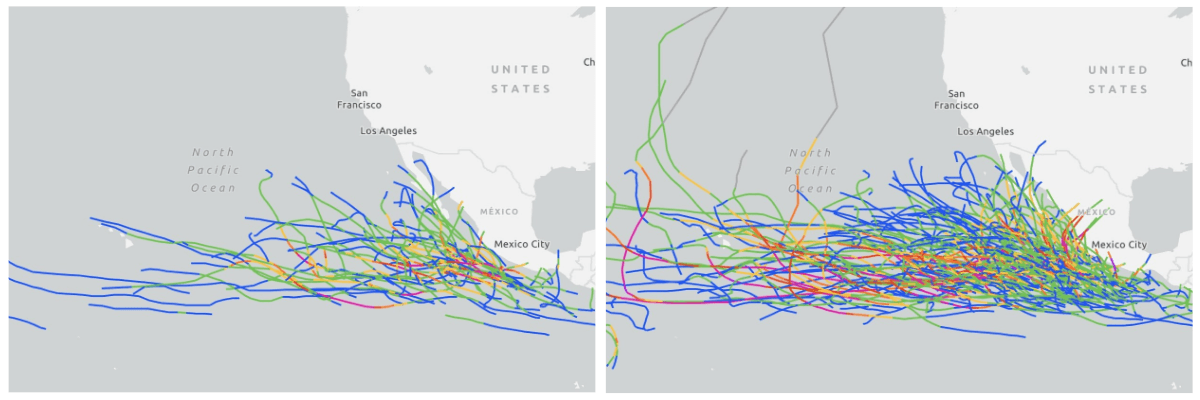
- Track maps of TS/HURRICANES that occurred in similar years (2017, 2013, 2011, 2001) (left) and track maps of TS/HURRICANES that occurred in the last 10 years (2015-2024) (right) (Source: NOAA)
Forecasts from Each Organization