In late February 2026, the Strait of Hormuz was blockaded. Over the following 100 days, nearly a thousand vessels have remained stranded within the Persian Gulf. Although a framework agreement between the U.S. and Iran to reopen the Strait of Hormuz is progressing, shipping companies have emphasized the need to ensure safety before resuming operations through the strait. At Weathernews, we have analyzed AIS positional data to compile insights on the vessels currently stranded in the Persian Gulf.
Trends in Vessel Counts within the Persian Gulf
As of January and February 2026, over 3,100 large vessels (exceeding 100 meters in length) were identified within the Persian Gulf. This figure represents the peacetime baseline supporting the import and export of crude oil, LNG, grains, and industrial products across the Gulf region, illustrating the sheer logistical scale of a maritime corridor that normally handles approximately 20% of global oil trade.
The situation changed drastically around late February when the blockade began. Vessel counts plummeted by approximately 40% in March compared to the previous month. Not only did new arrivals at major export ports decline sharply, but vessels already inside the Gulf were left stranded with their cargoes on board—exposing time-sensitive goods, such as agricultural bulk and perishables, to a high risk of degradation over the 100-day delay. This downward trend continued gradually through April and May, leaving current vessel traffic at merely 42% of pre-blockade levels.
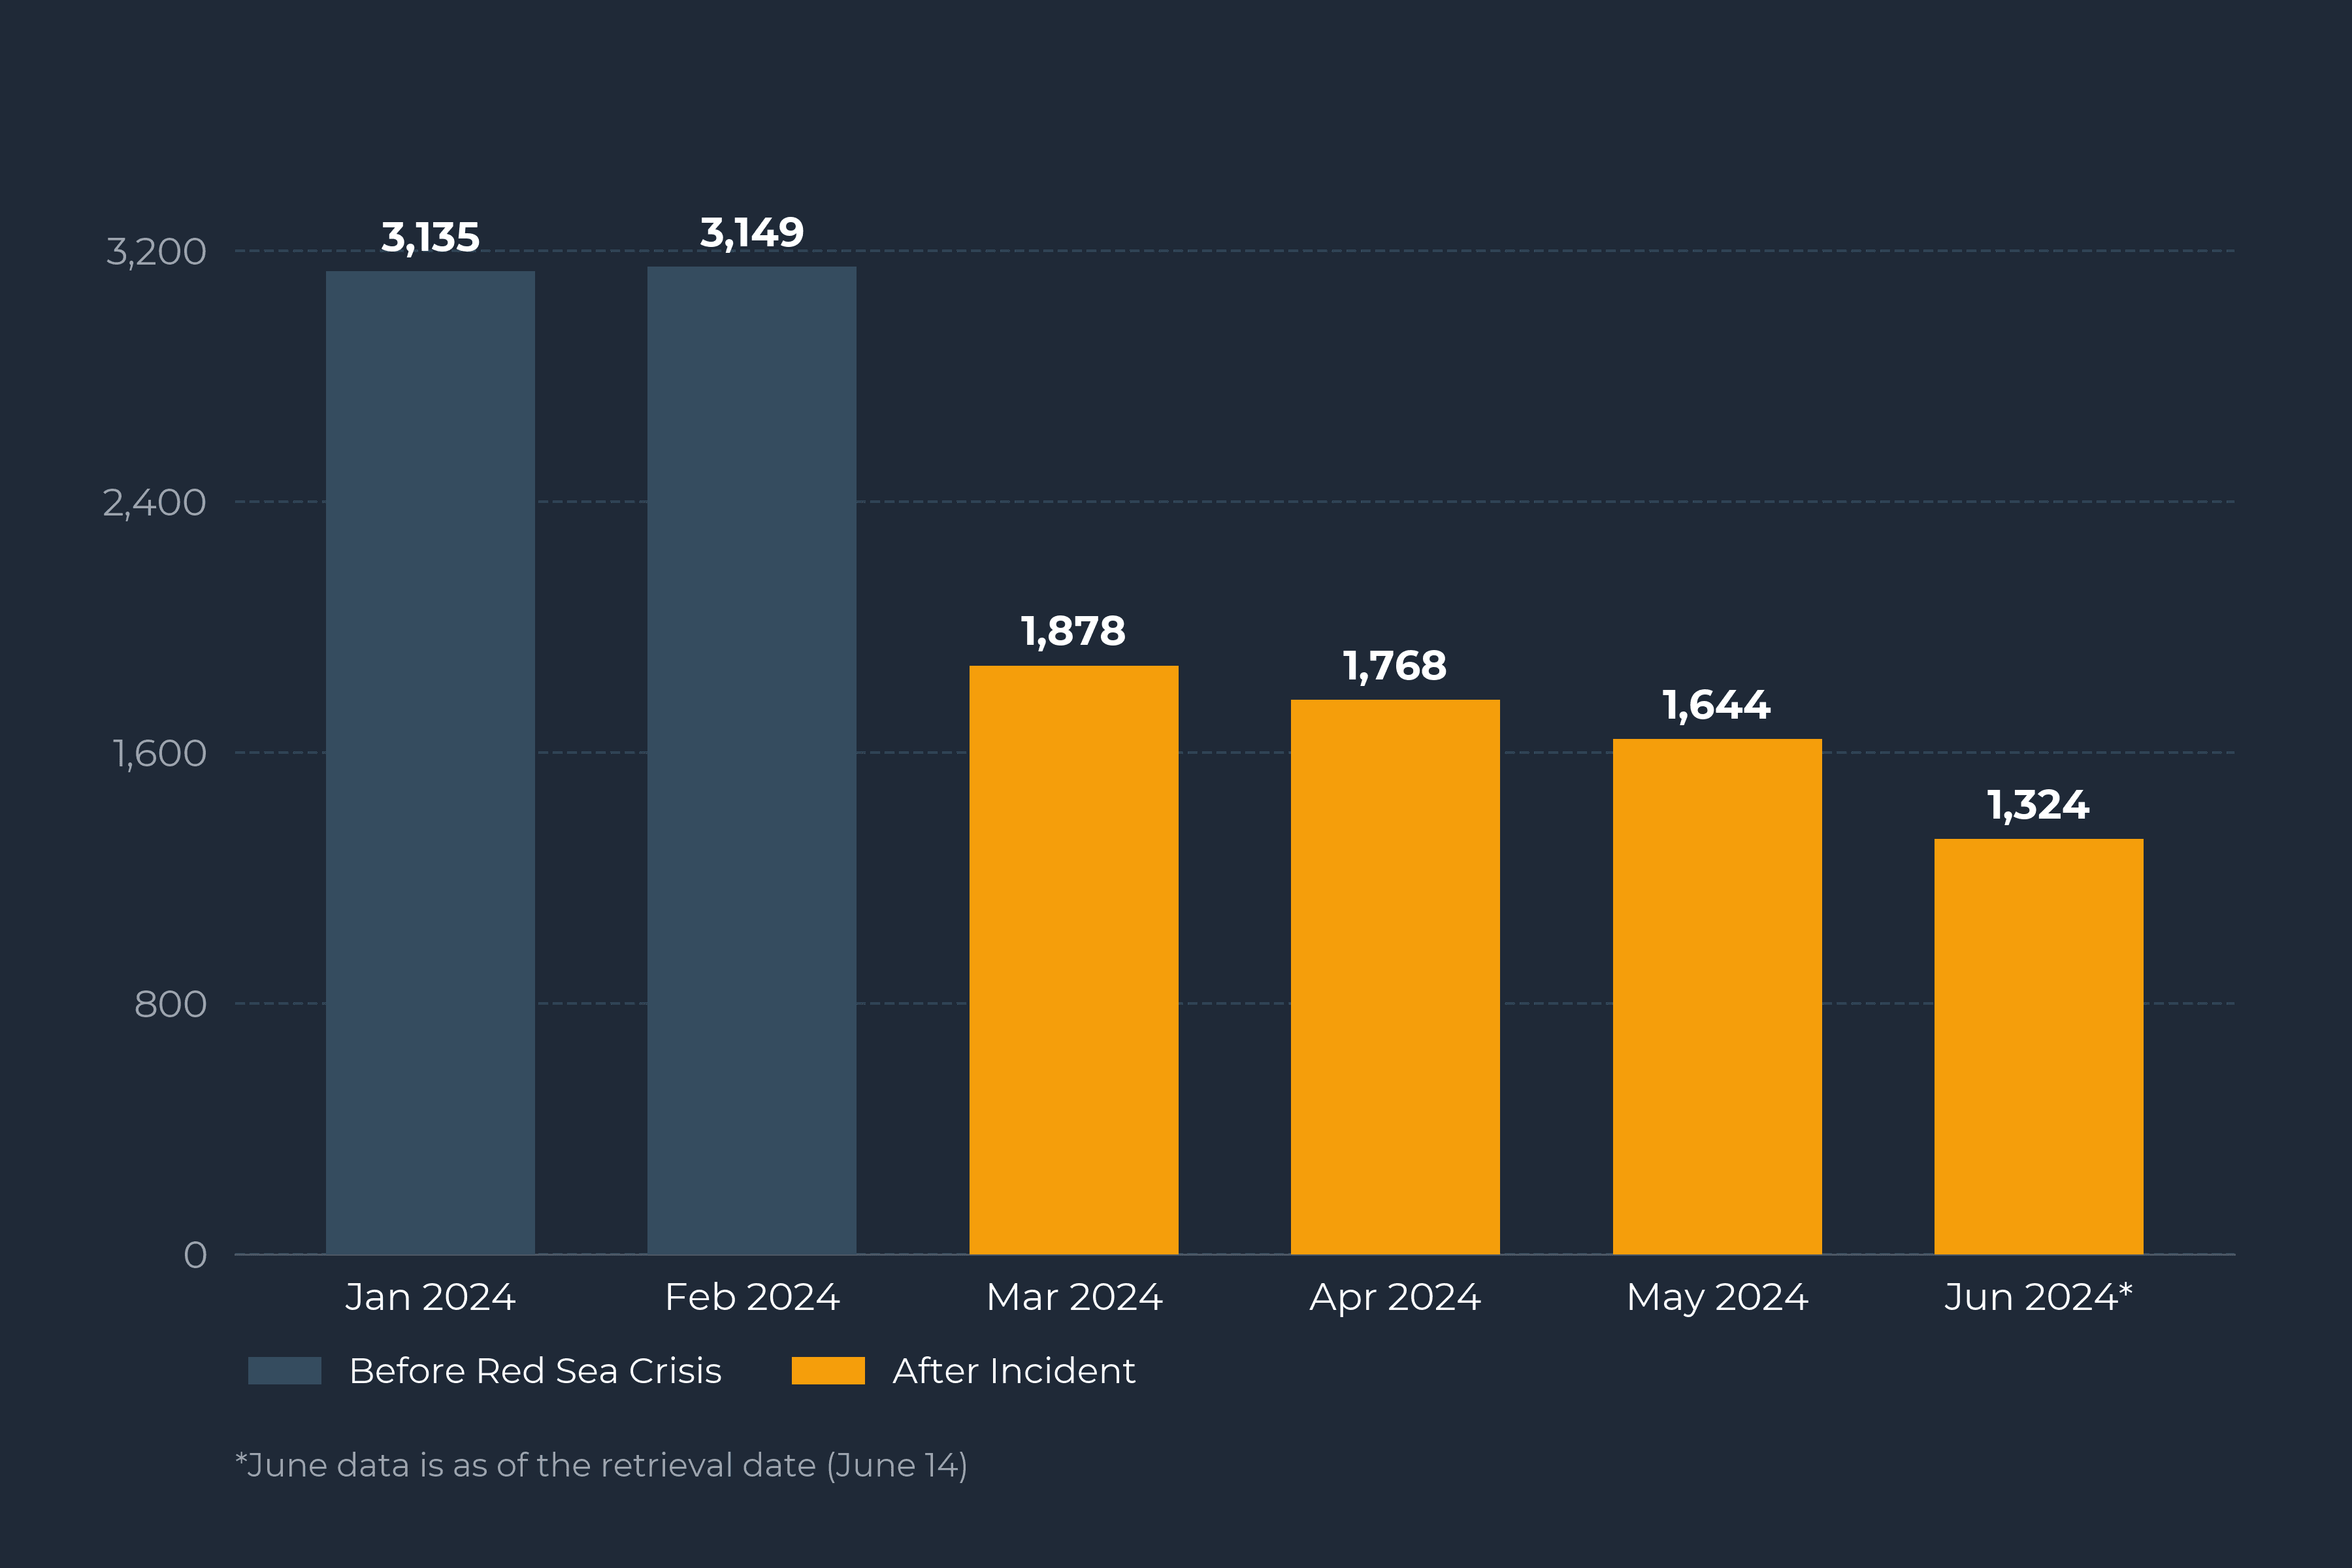
Figure 1: Monthly Vessel Traffic in the Persian Gulf (Jan–Jun 2026).
Distribution of Waiting Times
Commercial vessels are typically designed to remain in constant motion, moving from port to port. Operations rely on refueling during port calls and depend on shore-based facilities for medical support. This analysis highlights the distribution of waiting times for the 958 vessels currently stranded in the Persian Gulf, based on data from June 12–14.
Vessels that have been stranded in the Persian Gulf for 100 days or more total 602 ships (63%), accounting for over 60% of the entire fleet. For a fleet of this magnitude to be restricted to the Gulf since late February highlights a significant operational challenge: the sustained logistical strain of resupplying food, fresh water, fuel, and medical necessities for the crews on board.
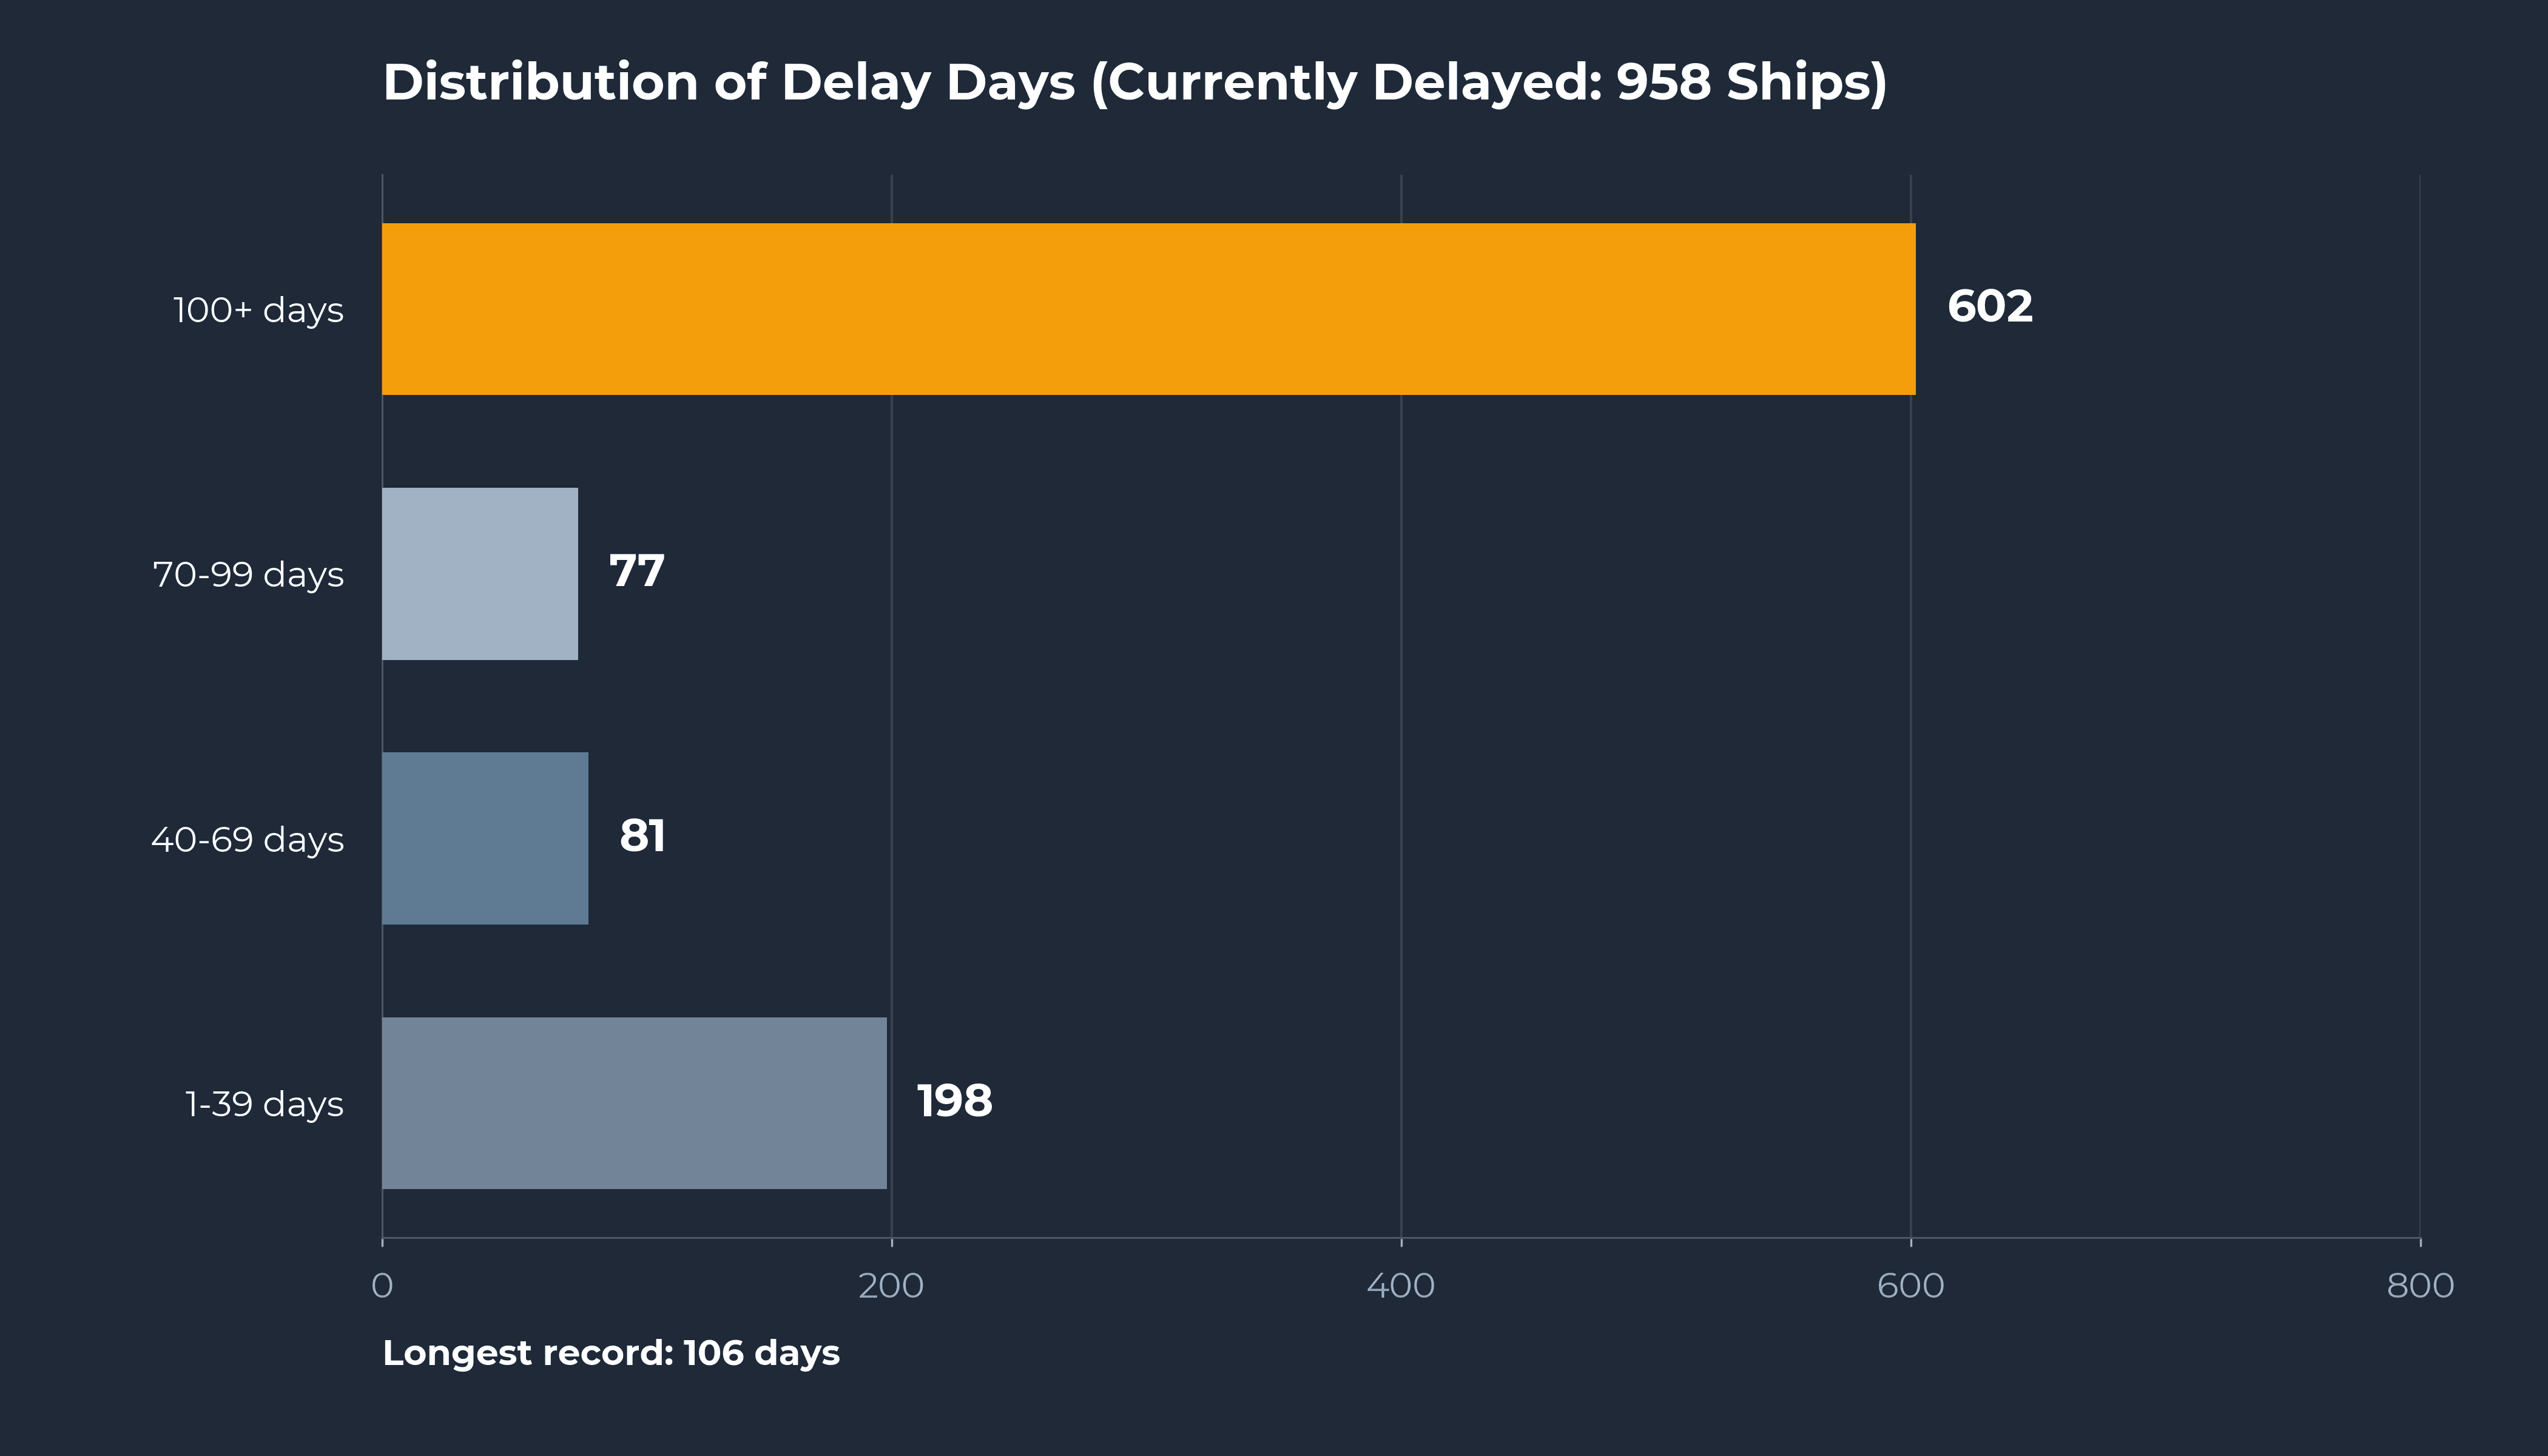
Figure 2: Waiting Time Distribution of Stranded Vessels (as of mid-June).
Beyond Crude Carriers: A Wider Scope of Stranded Vessels
Taking a closer look at the types and cargoes of the 958 vessels currently stranded in the Persian Gulf reveals a broader picture.
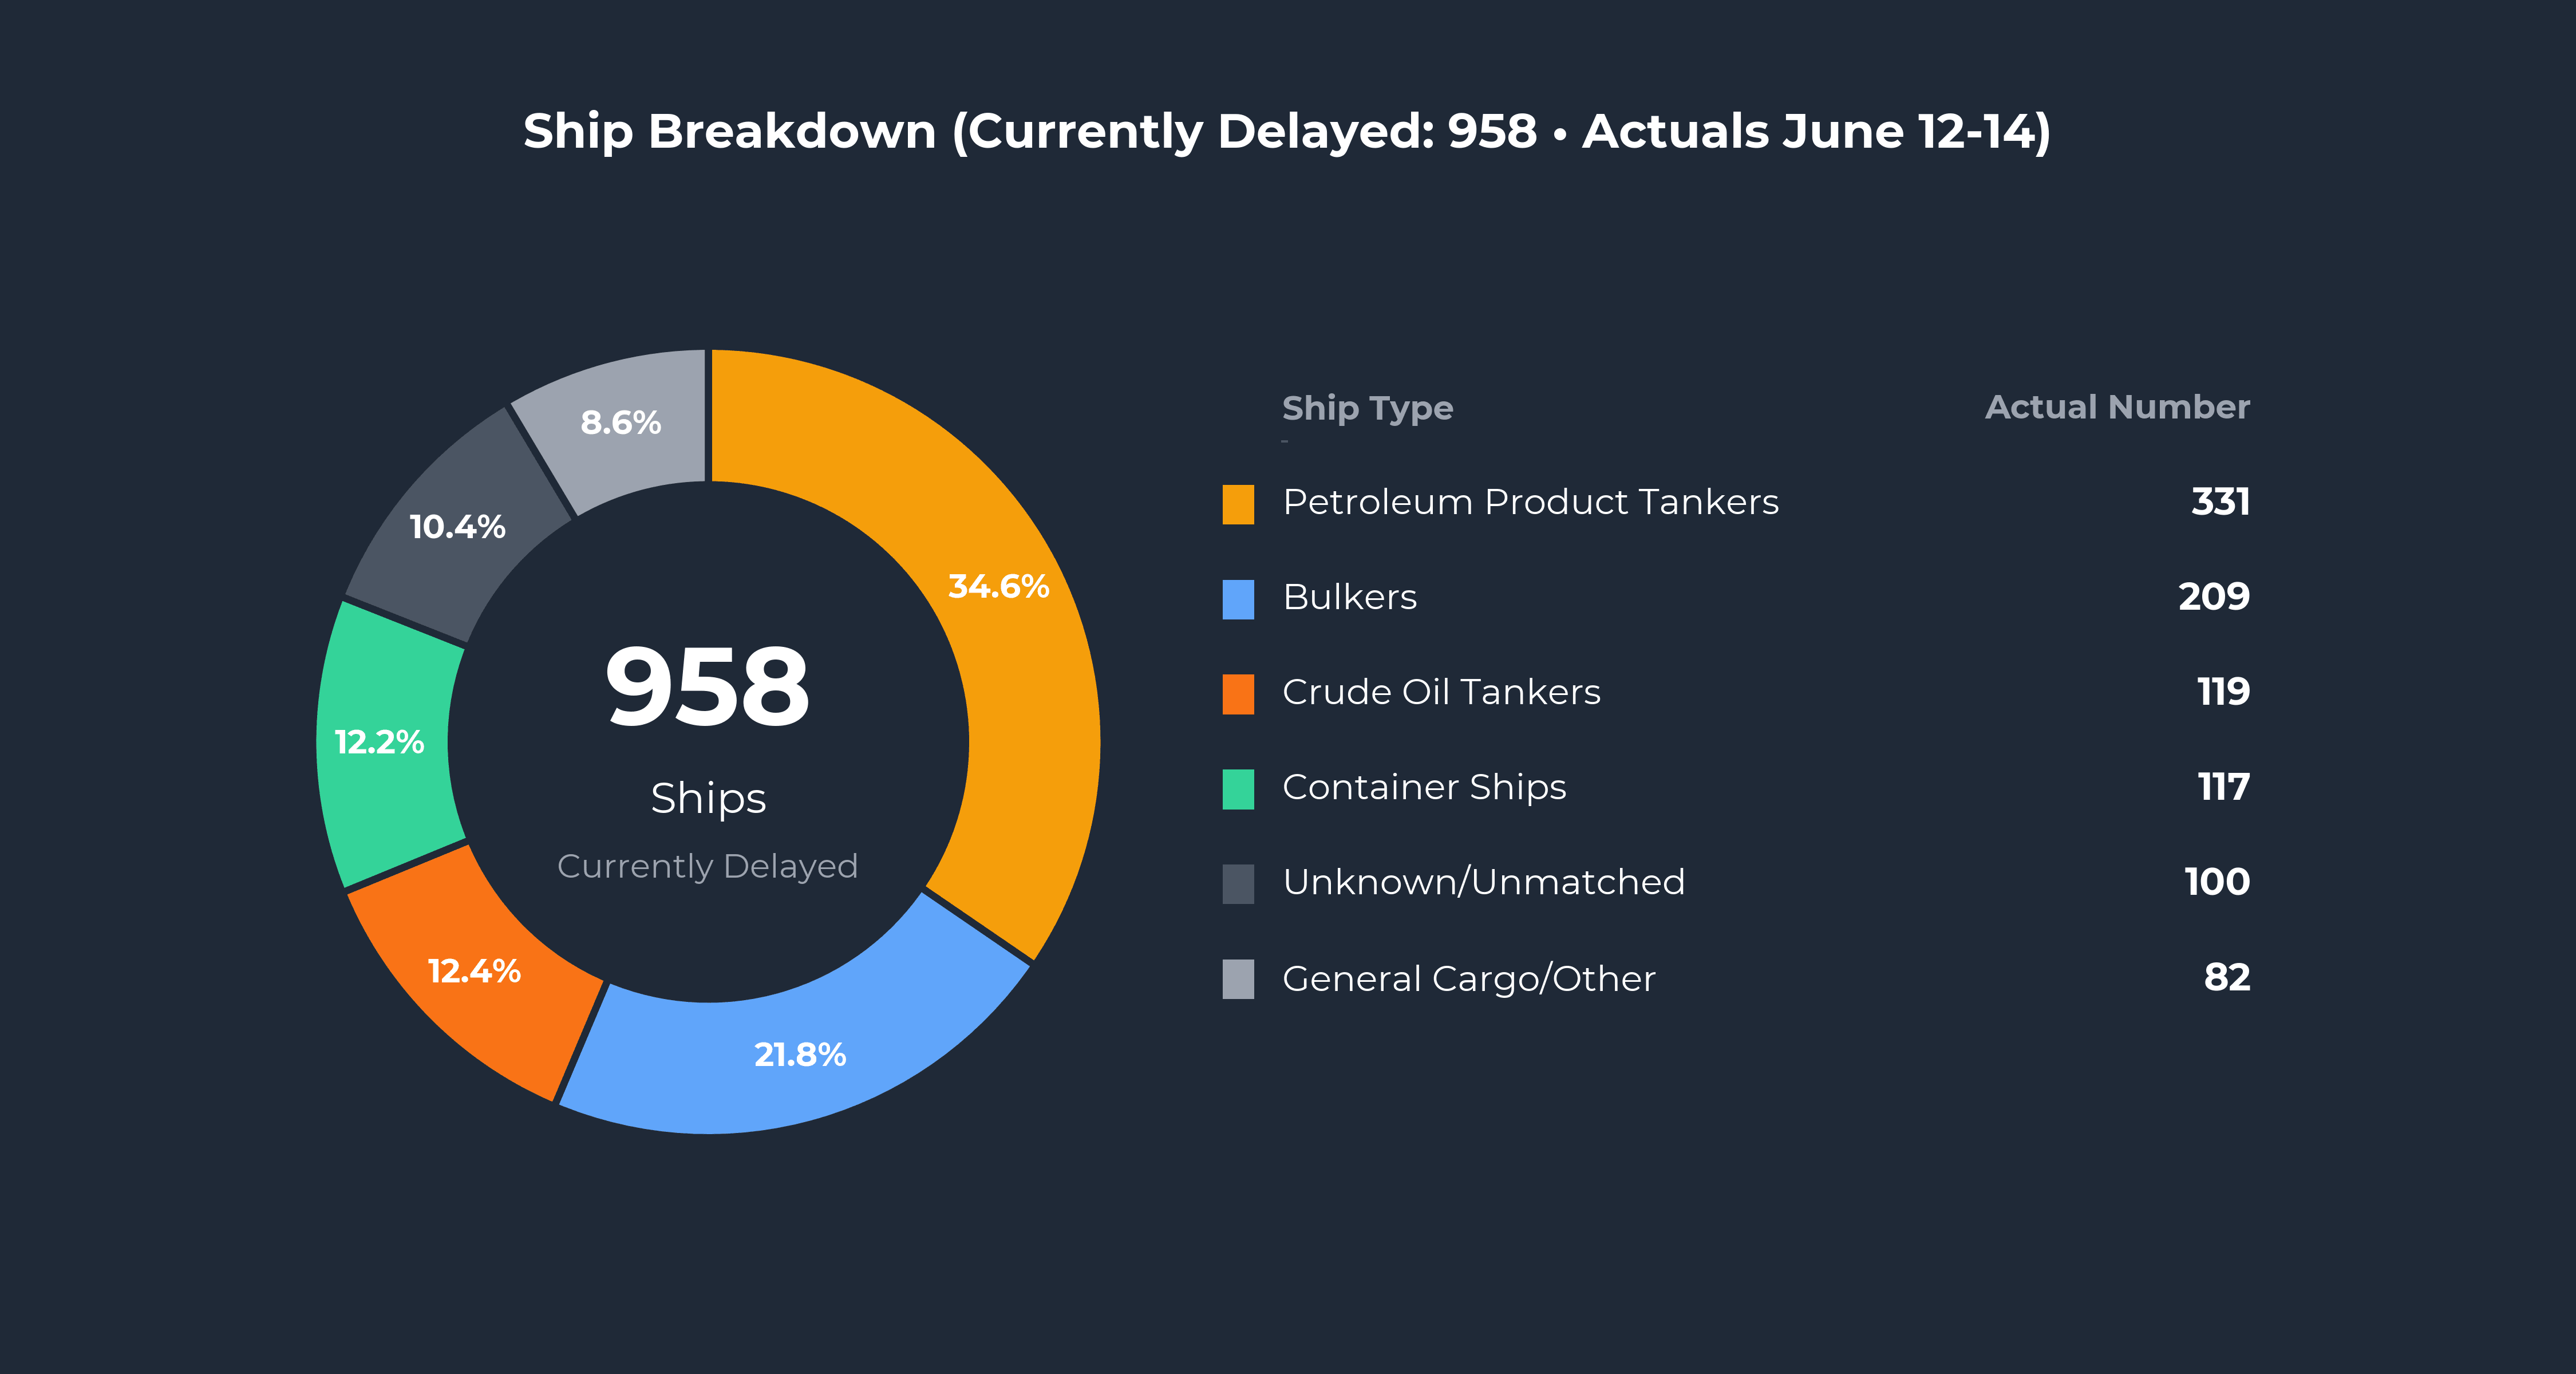
Figure 3: Breakdown of Stranded Vessels by Category.
Oil product tankers currently make up the largest share, with 331 vessels (34.5%). This is followed by 209 bulk carriers (21.8%), 119 crude oil tankers (12.4%), and 117 container ships (12.2%). While crude oil tankers account for just 12% of the total, product tankers carrying gasoline, jet fuel, and naphtha comprise 34%, indicating that the blockade's impact extends deeply into supply chains far beyond crude energy.
Beyond the energy sector, the positional data evidences a broad disruption to key components of global consumer and industrial markets. Together, product tankers, bulk carriers, and container ships account for nearly 70% of all stranded vessels. Supply chains carrying food, construction materials, and auto parts—essential elements supporting regional and global economies—have been effectively immobilized at sea. This illustrates how geopolitical events affect not only energy markets but also the flow of everyday essential goods.
AIS Source Data: Marine Traffic by Kpler. Tanker classification is based on deadweight tonnage: vessels of 80,000 DWT or above (Aframax and larger) are classified as crude oil tankers, while those below are categorized as oil product tankers. As a result, this analysis may contain a certain degree of misclassification.