


2026 Typhoon Season Outlook: Above-Normal Activity as El Niño Intensifies
Weathernews' latest seasonal analysis projects an above-normal typhoon season for the Northwest Pacific, with an estimated 28 to 29 tropical storms or typhoons forming over the full year. A strong El Niño event, with the potential to rank as the strongest on record, is the dominant atmospheric driver for the season, influencing formation zones, intensification trends, and approach risk particularly for Japan. The North Indian Ocean is forecast to remain near normal across both the Arabian Sea and the Bay of Bengal, with activity picking up primarily during the post-monsoon season.
1. Northwest Pacific & South China Sea (Typhoons)
Through August 16, 19 typhoons have already formed in 2026 (with 1 additional formation expected during the remainder of August), running about 5 above the climatological average for this period. From September onward, the formation rate is projected to proceed at a roughly normal pace, contributing an estimated 11 to 12 additional tropical storms or typhoons over the remainder of the season.
The full-season annual total is projected at 28 to 29, placing 2026 in the above-normal category. This aligns closely with WNI's proprietary AI statistical forecast, which projects 11.0 formations from September onward—near normal relative to the climatological average of 11.6 (JMA).

Monthly and annual typhoon formations for the Northwest Pacific and South China Sea — 2026 WNI forecast vs. normal. August figures include both actuals and forecasts. Normal values defined by the Japan Meteorological Agency (JMA).
Reference Years and Historical Patterns
This year's atmospheric setup closely resembles the seasons of 2023, 2018, 2015, 2009, 2002, and 1997, based on similarities in sea surface temperature (SST) anomalies and atmospheric circulation patterns across the El Niño monitoring region (NOAA) and the Indian Ocean.
Drawing on these analog years and Weathernews' proprietary AI statistical forecast:
- WNI Proprietary AI Statistical Forecast: The number of occurrences from September onward is expected to be about 1 fewer than the average year (11.6): 11.0.
- Monthly Typhoon Formation Trends Based on Similar Years: The average number of occurrences from September onward is about 2 fewer than the normal year (11.0): 9.0.
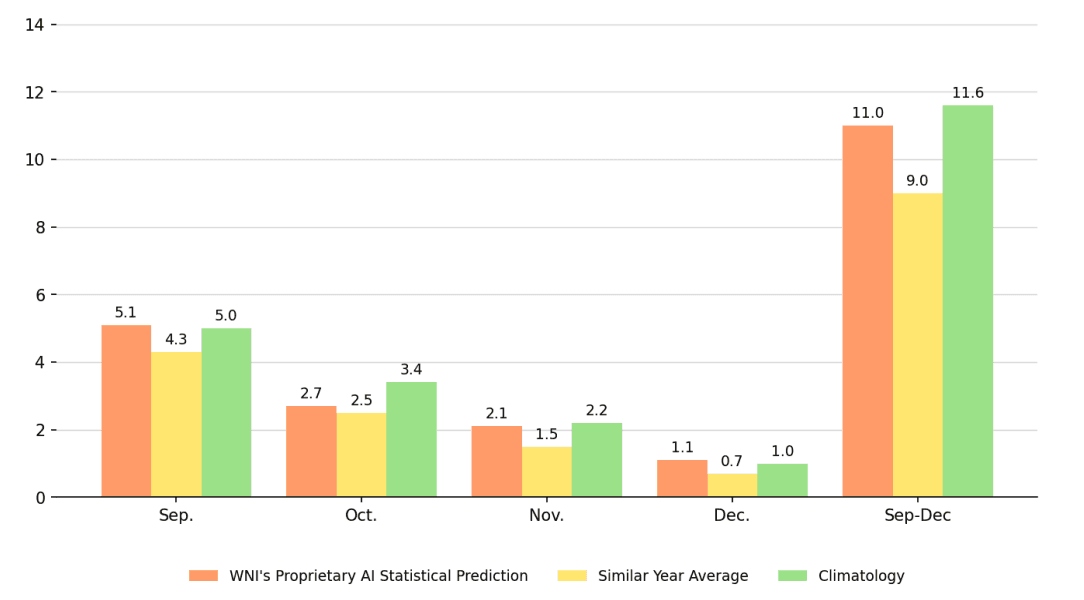
Monthly Northwest Pacific typhoon formation forecast (Sep–Dec) — WNI AI statistical prediction, similar year average, and climatology (JMA statistics). Source: WNI Forecast Center, August 2026
Note on WNI Proprietary AI Statistical Forecast: A forecast using a machine learning model trained on historical tropical convective activity.
Note on Similar Years: Years where SST anomalies and atmospheric circulation in the El Niño monitoring region (NOAA) and the Indian Ocean resemble this year's forecast (2023, 2018, 2015, 2009, 2002, and 1997). Similar year averages and normal values are based on JMA statistics. Due to rounding, the sum of the monthly averages may not exactly match the annual average.
Atmospheric & Oceanic Conditions Behind the Forecast
Latter Half of the Season (September–November)
As the season progresses, El Niño has the potential to develop into the strongest event on record. A positive Indian Ocean Dipole (pIOD) event may also occur, shifting toward basin-wide warming in the tropical Indian Ocean during the latter half of the season.
- Sea Surface Temperature: Tropical Pacific SSTs are considerably above normal in the east, with a near-normal to slightly below-normal tendency in the west. The tropical Indian Ocean is above normal toward the west and near normal toward the east.
- Convective Activity: Convective activity is active over the central-to-eastern tropical Pacific, with a clear tendency to shift eastward through November. Convection remains suppressed across the Maritime Continent. In the Indian Ocean, active convection over the southern Arabian Sea is gradually expanding into the southern Bay of Bengal.
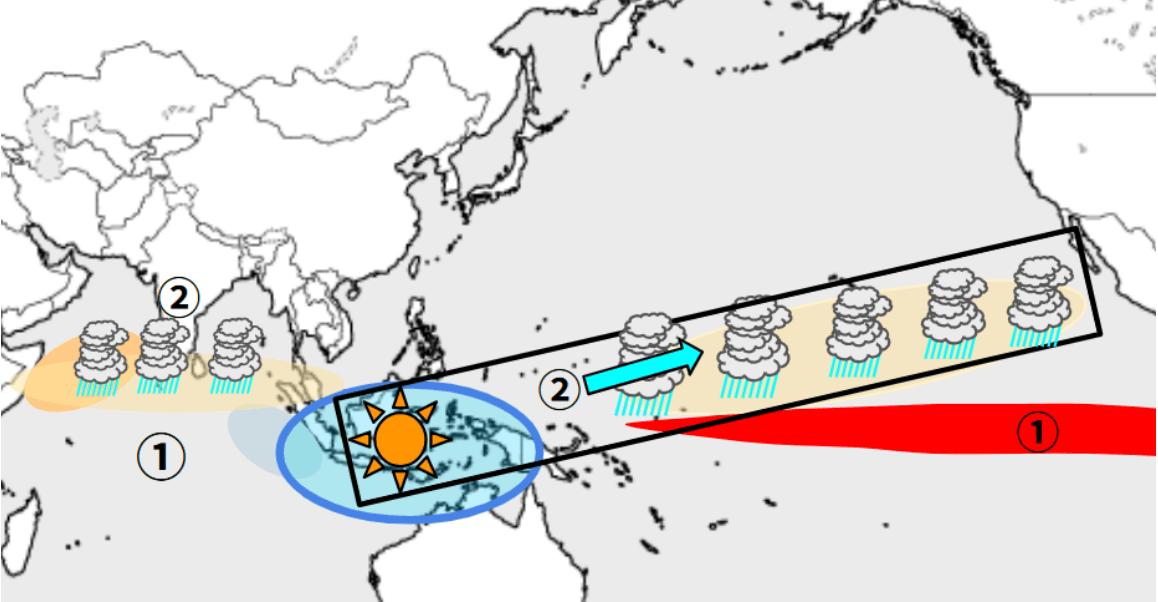
Tropical convective activity patterns for September to November 2026, showing sea surface temperature anomalies and active convective zones across the Pacific and Indian Oceans. (WNI Forecast Center, August 2026)
Typhoon Risk Areas
In September, typhoon risk tends to be elevated mainly from the Nansei Islands to western Japan. From October onward, the main risk zone concentrates in areas south of Japan and across the South China Sea.
From September onward, risk areas shift farther east than normal, with a higher-than-normal risk developing south and southeast of Honshu relative to the climatological average.
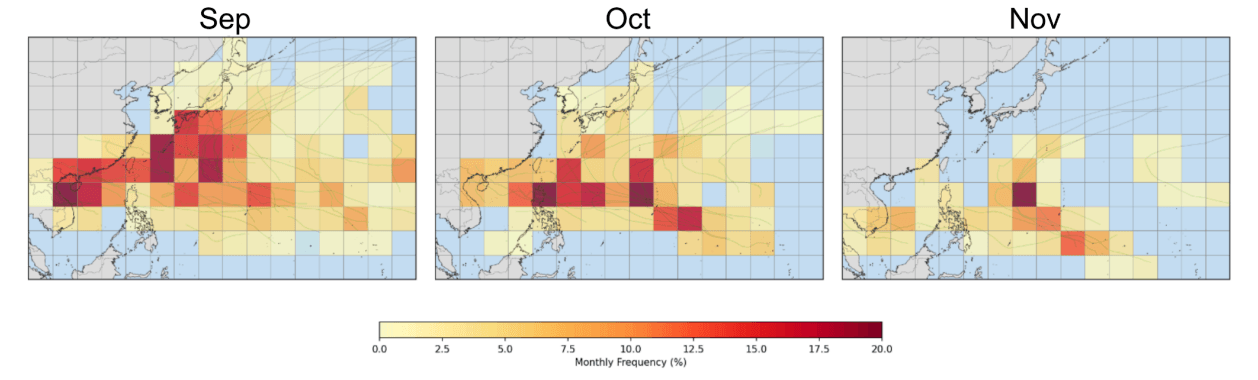
Northwest Pacific typhoon presence frequency — analog years, annual & monthly (Sep–Nov). Source: WNI, JMA Best Track Data
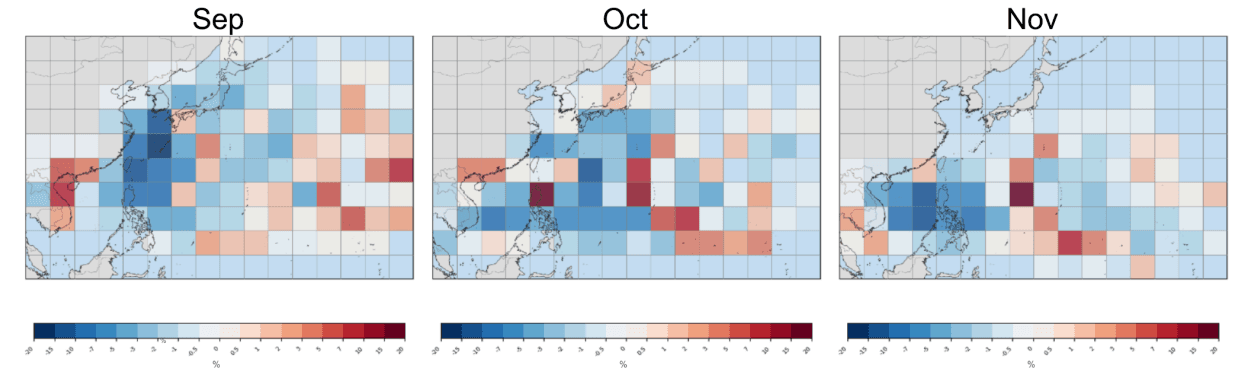
Northwest Pacific typhoon presence frequency anomalies — analog years vs. climatology, annual & monthly (Sep–Nov). Source: WNI, JMA Best Track Data
Approach Frequency for Japan
The number of approaches to mainland Japan (Hokkaido, Honshu, Shikoku, and Kyushu) and Okinawa/Amami is expected to be near normal overall for the autumn period, though September approaches may run about one fewer than normal:
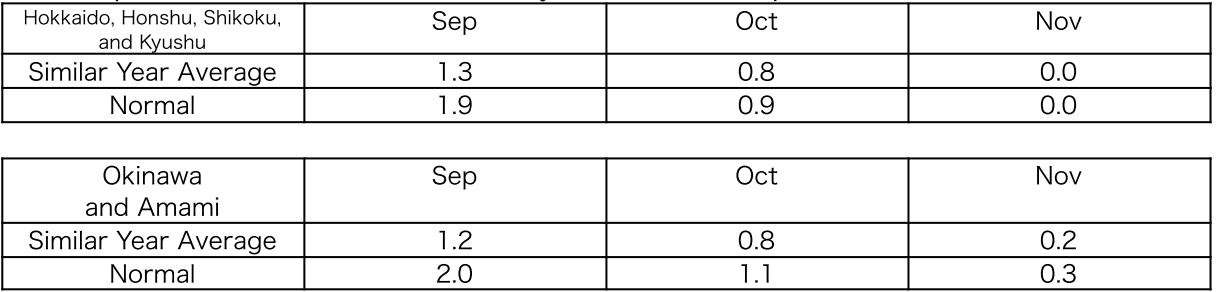
Typhoon approach counts based on analog years vs. climatological normal (JMA statistics).
Typhoon Intensity
A major feature of the updated 2026 outlook is the strong possibility of intense or long-lived typhoons occurring. Because genesis locations are shifted farther east than usual, storms will track over higher-than-average sea surface temperatures for longer durations, favoring severe storm intensification. This trend is expected to be particularly pronounced in September.
According to Tropical Storm Risk (TSR / University College London), the 2026 Accumulated Cyclone Energy (ACE) is forecast at approximately 500—about 1.7 times the 30-year climatological normal (301) and 2.0 times the past 10-year average (250). ACE per typhoon is projected at 17.9, compared to the normal of 11.8 and the 10-year average of 10.4.
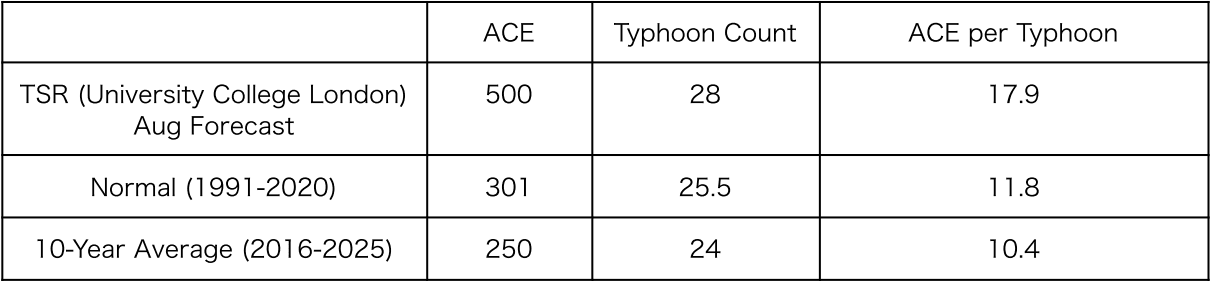
2026 Northwest Pacific seasonal intensity forecast: ACE, typhoon count, and ACE per typhoon vs. climatological normal and past 10-year average. Source: TSR (University College London), August 2026 (ACE per typhoon calculated by WNI).
Atmospheric Steering & Reference Analog Cases
During September, the mid-latitude westerlies near Japan are expected to meander farther north than normal at times. While typhoons steered into Japan usually weaken during their approach, storms tracking directly northward from south of Japan can approach near peak intensity before interacting with the westerlies. Typhoon HIGOS (2002) and Typhoon JEBI (2018) serve as primary analog cases for this track pattern.
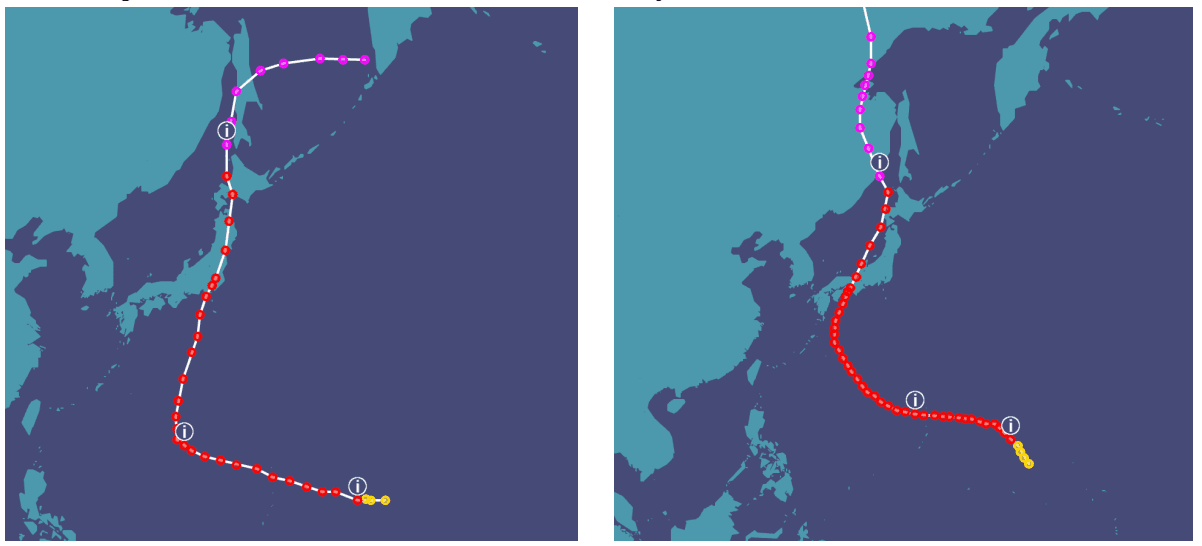
Reference typhoon tracks — Typhoon HIGOS (T0221, left: 930 hPa, 50 m/s) and Typhoon JEBI (T1821, right: 915 hPa, 55 m/s), illustrating the northward approach pattern toward Japan near peak intensity. Source: WNI, JMA Best Track Data
2. North Indian Ocean (Arabian Sea & Bay of Bengal)
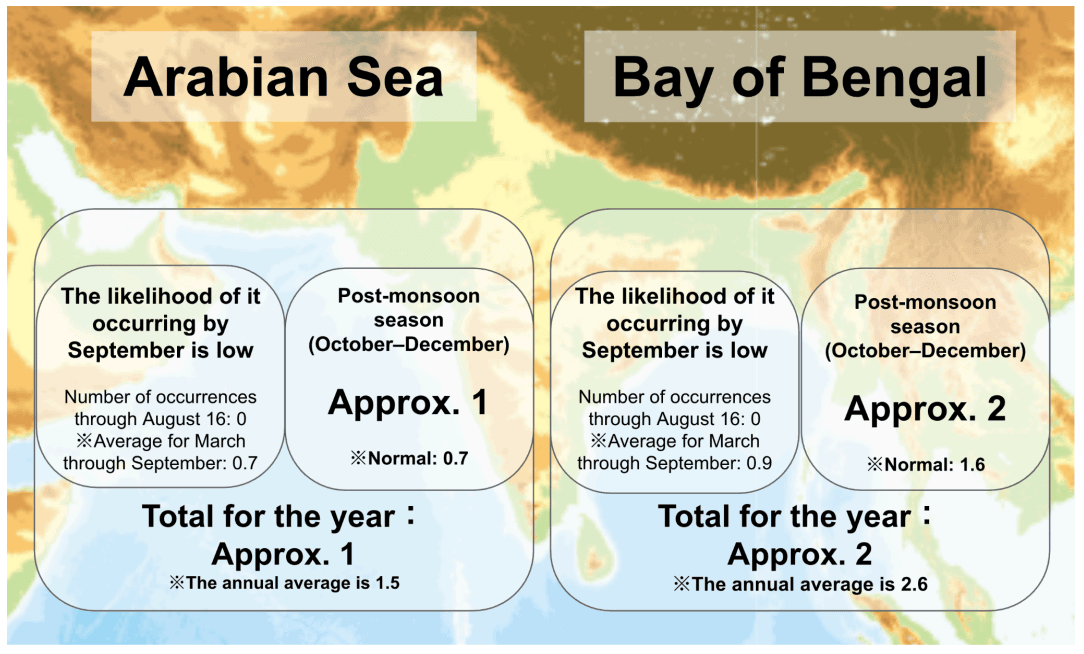
Cyclonic activity in the North Indian Ocean follows a bimodal distribution, with formation peaks during the pre-monsoon (Apr–May) and post-monsoon (Oct–Dec) periods. Through August 16, no tropical cyclones formed in either basin. Formation likelihood remains low through September, with activity concentrating in the post-monsoon season.
Arabian Sea
Through September, formation likelihood is low (0 observed through Aug 16; March–Sept average is 0.7).
- Post-Monsoon (Oct–Dec): ~1 cyclone expected (Normal: 0.7).
- Annual Total: ~1 cyclone (Normal: 1.5).

Monthly Arabian Sea cyclone formation averages — analog years (Average: 1.7 vs. Normal: 1.5).
Bay of Bengal
Through September, formation likelihood is low (0 observed through Aug 16; March–Sept average is 0.9).
- Post-Monsoon (Oct–Dec): ~2 cyclones expected (Normal: 1.6).
- Annual Total: ~2 cyclones (Normal: 2.6).

Monthly Bay of Bengal cyclone formation averages — analog years (Average: 3.0 vs. Normal: 2.6). Source: WNI, IMD
Reference Years and Historical Patterns
This year's atmospheric setup closely resembles the seasons of 2023, 2018, 2015, 2009, 2002, and 1997, based on similarities in SST anomalies and atmospheric circulation patterns across the El Niño monitoring region (NOAA) and the Indian Ocean.
- Northwest Pacific (Sep–Dec): WNI's proprietary AI statistical forecast points to 11.0 formations (near the normal of 11.6). Analog years average 9.0 formations.
- North Indian Ocean: Across similar years, annual cyclone formations averaged 1.7 in the Arabian Sea and 3.0 in the Bay of Bengal.
Looking for another basin? Read our latest 2026 outlook for the Atlantic & East Pacific →