Season Outlook
The 2026 season is shaping up to be defined by one dominant signal: a developing El Niño, with the potential to strengthen into a Super El Niño during the second half of the season. This single climate driver pulls the three basins in different directions — suppressing activity in the North Atlantic, holding the Northeast Pacific near normal, and energizing the Central Pacific. Weathernews' latest analysis breaks down what to expect from June through November.
As of May 28 2026, no tropical storms or hurricanes had formed across any of the three basins, and none were expected through the remainder of May.
1. North Atlantic Outlook
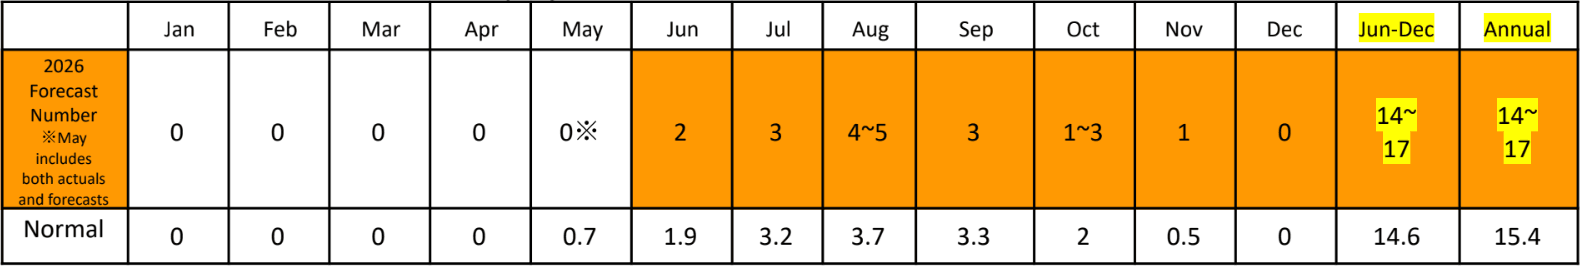
For the North Atlantic, Weathernews forecasts around 11 to 16 tropical storms or hurricanes this season — a total we classify as near or below normal. Formation through the peak months of July to October is expected to run near or slightly below normal, while the remaining months should proceed at a generally near-normal pace.
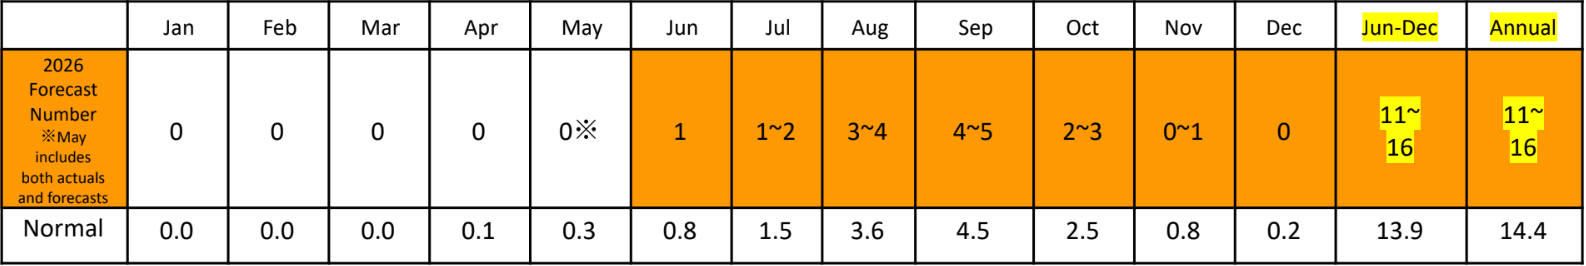
Monthly and annual TS/hurricane formations for the North Atlantic — 2026 WNI forecast vs. normal. May figures include both actuals and forecasts. Normal values compiled by WNI based on NOAA data.
The key reason is El Niño. As it develops, convective activity across the tropical Atlantic tends to be suppressed, creating a less favorable environment for storms to spin up. The result is a season that, while still capable of producing impactful systems, is likely to fall on the quieter side of the historical range.
2. Northeast Pacific Outlook (~140°W)
The Northeast Pacific is forecast to see around 14 to 17 tropical storms or hurricanes, placing the season firmly in the near-normal category. Formation is expected to proceed at a generally near-normal pace from June onward.
Monthly and annual TS/hurricane formations for the Northeast Pacific (~140°W) — 2026 WNI forecast vs. normal. May figures include both actuals and forecasts. Normal values compiled by WNI based on NOAA data.
The most notable feature here is positional rather than numerical: as El Niño develops, the zone of active convection is expected to shift westward through September. This nudges the main development and risk areas away from their usual footprint — an important nuance for routing decisions even in an otherwise "average" year.
3. Central Pacific Outlook (140°W–180°W)
The Central Pacific is where El Niño's fingerprint shows up most clearly. Weathernews forecasts 2 to 4 formations this season — roughly 1 to 3 above normal — making this a comparatively active year for a basin that is typically quiet.
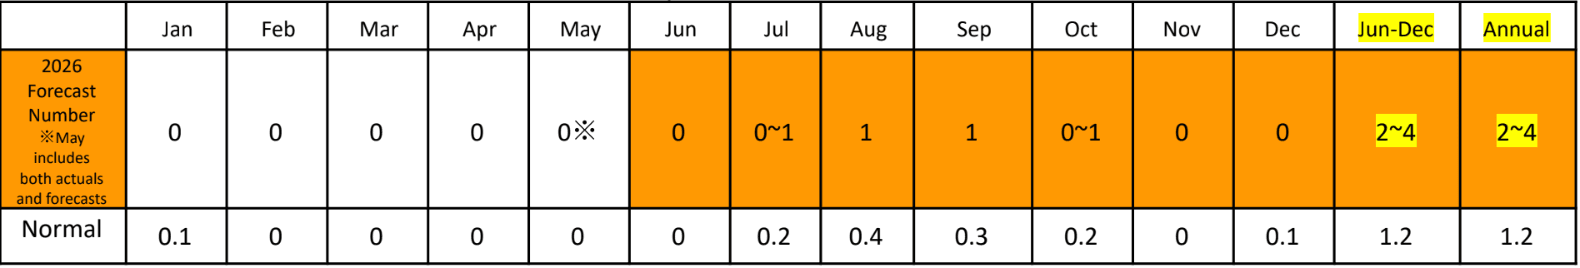
Monthly and annual TS/hurricane formations for the Central Pacific (140°W–180°W) — 2026 WNI forecast vs. normal. May figures include both actuals and forecasts. Normal values compiled by WNI based on NOAA data.
Convective activity across the Central Pacific is expected to be enhanced under El Niño conditions. The elevated risk comes from two sources: storms forming within the basin itself, and systems tracking in from the Northeast Pacific as the active convective zone shifts westward.
Reference Years and Historical Patterns
This year's setup — based on sea surface temperature anomalies and atmospheric circulation across the El Niño monitoring region and the Indian Ocean — closely resembles the seasons of 2023, 2018, 2015, 2009, 2002, and 1997, all years with comparable El Niño signatures.
Drawing on these analog years and Weathernews' proprietary AI statistical forecast:
1. North Atlantic
The WNI AI statistical forecast points to about 13.6 formations from June onward (near the normal of 13.9). Analog years suggest a slightly quieter outcome, averaging 12.0 from June onward and 12.5 annually — roughly one below the long-term normal.
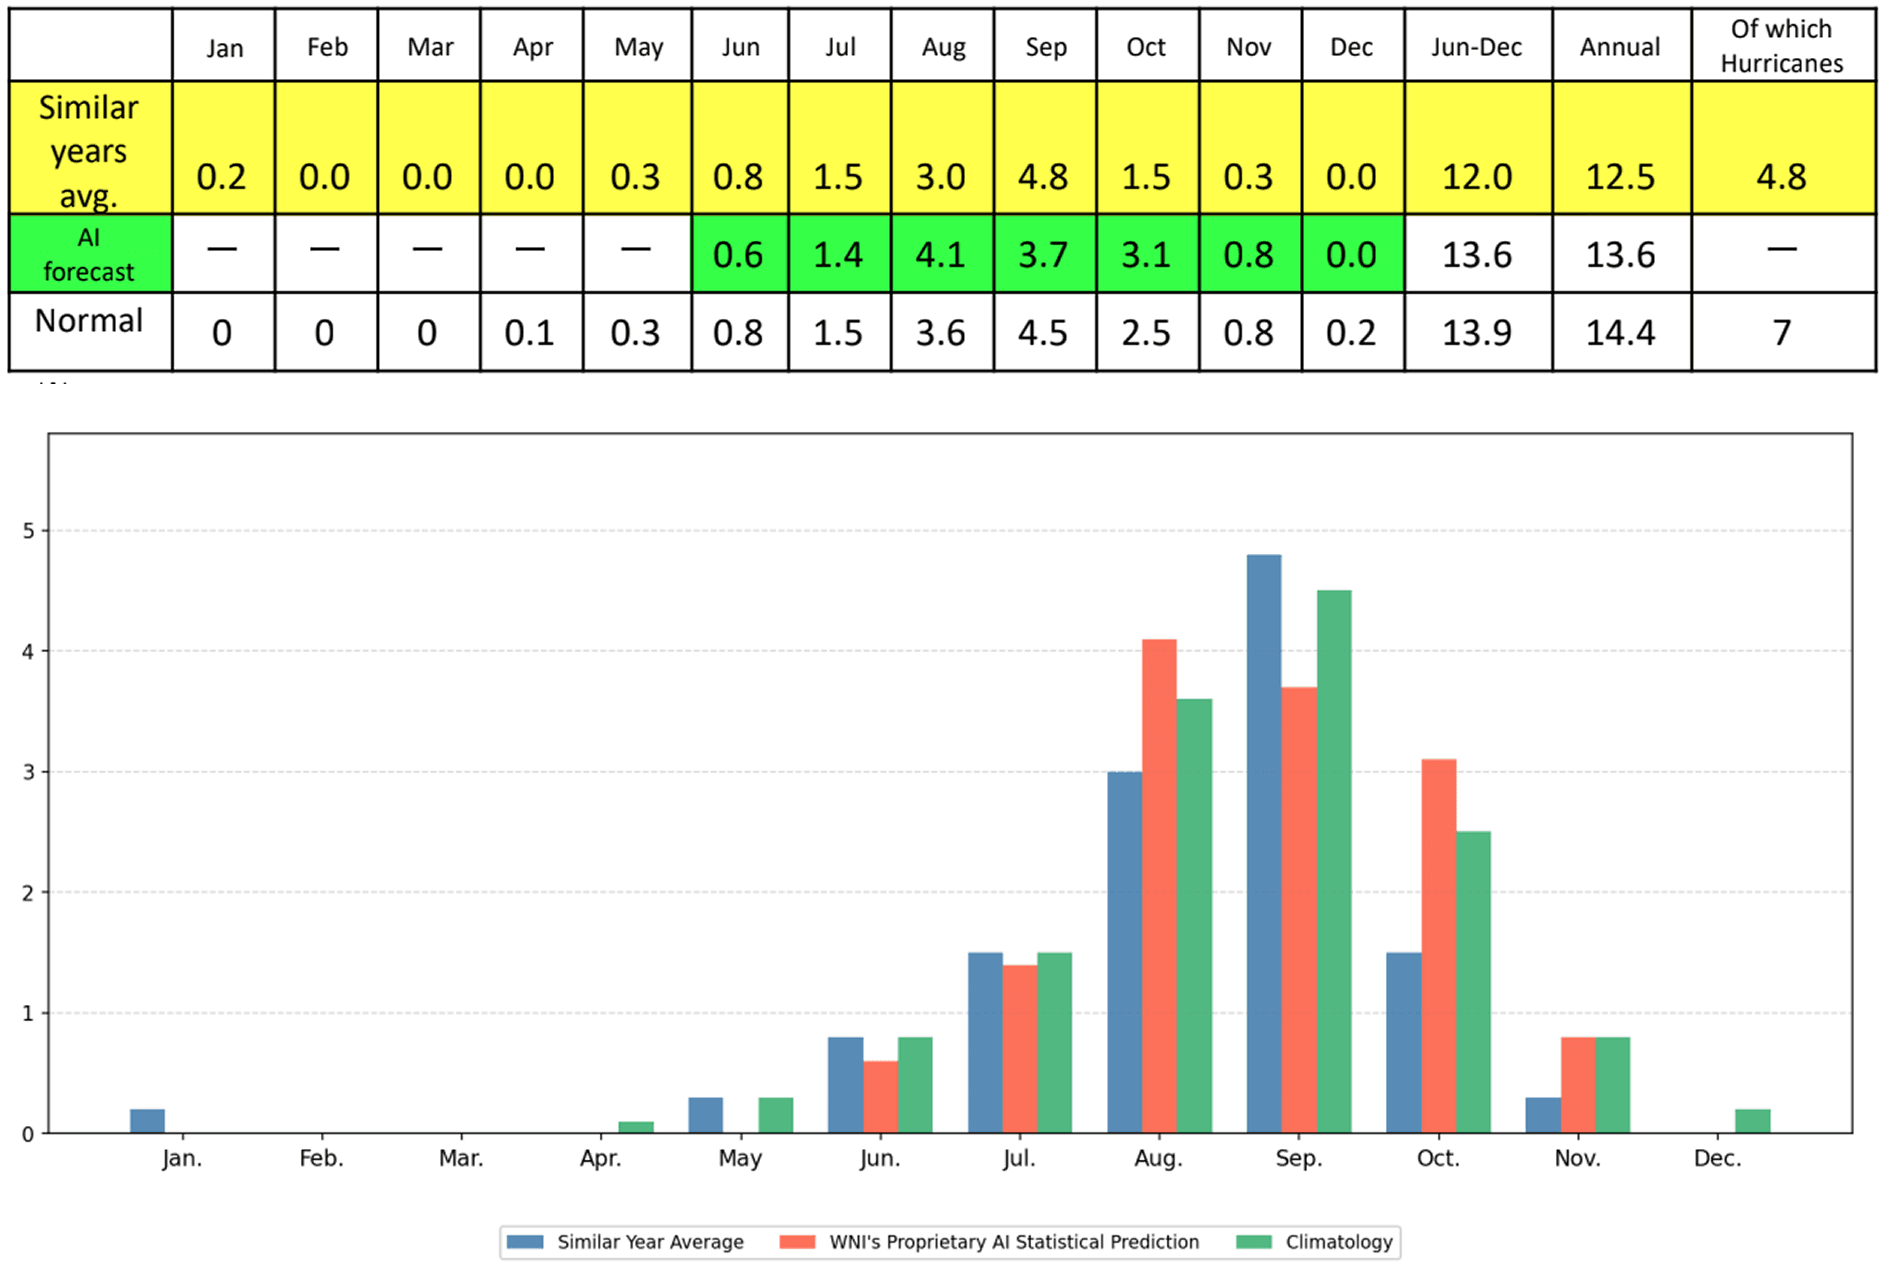
North Atlantic — AI statistical forecast and analog-year monthly formation trends.
2. Northeast Pacific
The AI statistical forecast indicates 13.6 formations from June onward (about one below normal), while the analog years run a touch busier at 16.8 from June onward and 17.2 annually — about two above normal.
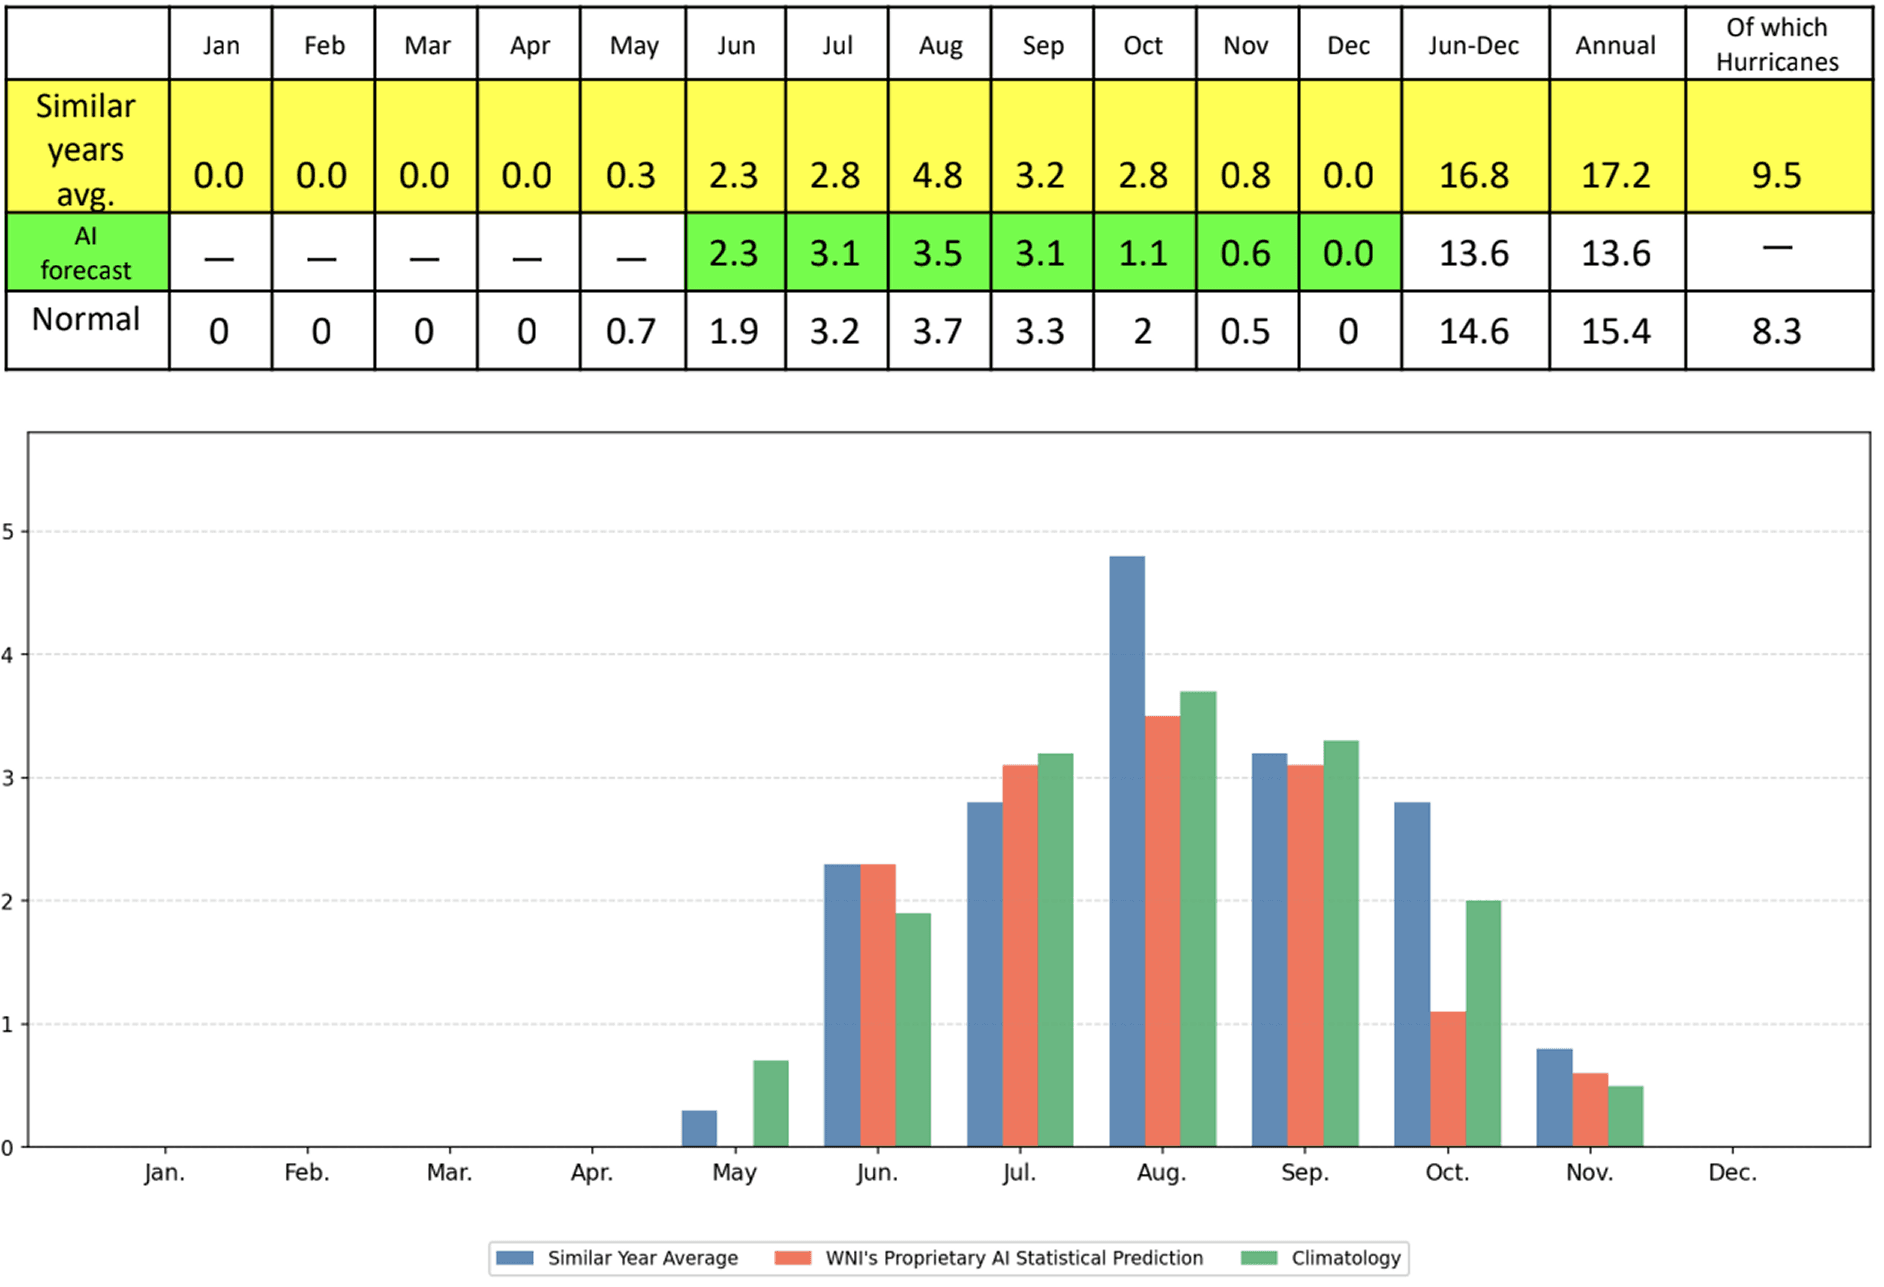
Northeast Pacific — AI statistical forecast and analog-year monthly formation trends.
3. Central Pacific
Analog years average 2.7 formations both from June onward and annually — about two above the normal of 1.2, reinforcing the above-normal outlook.
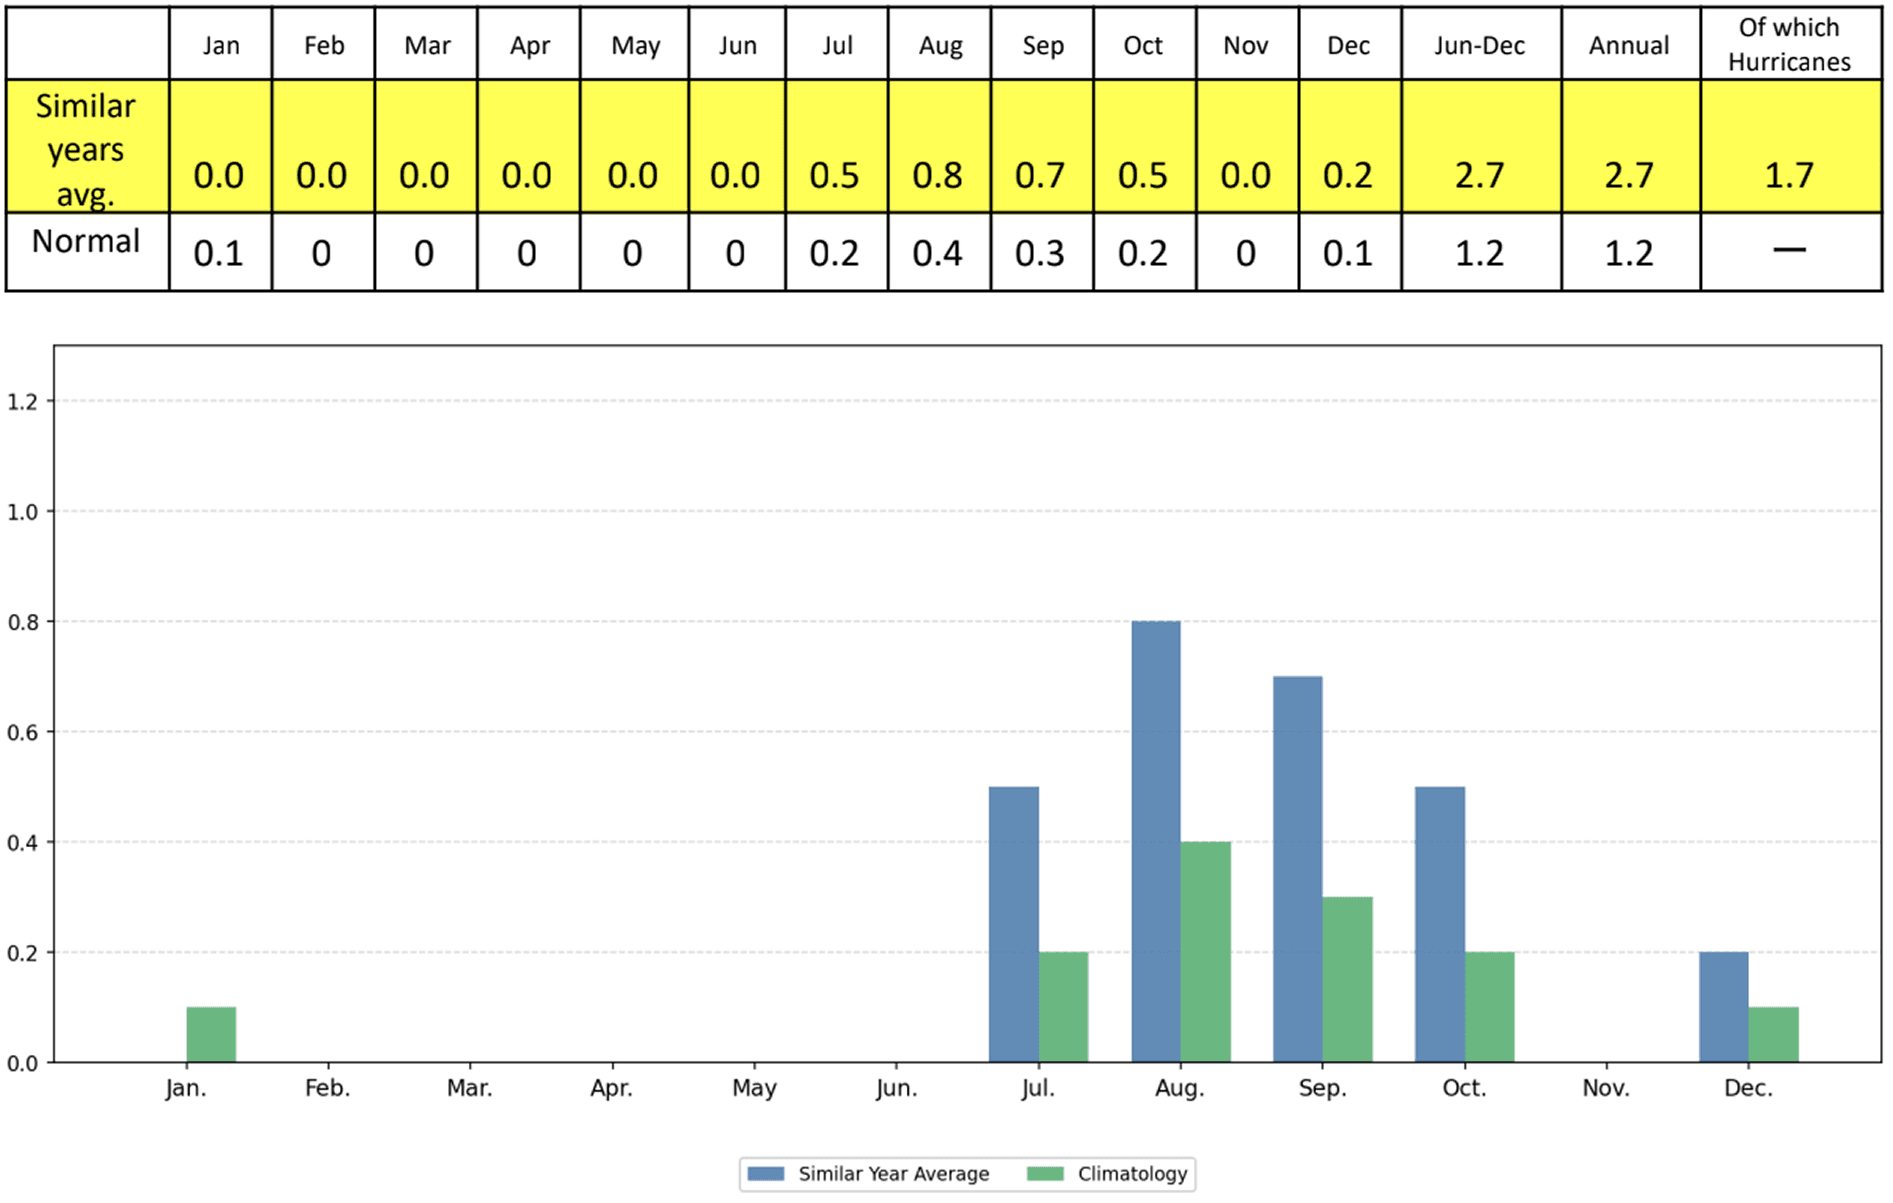
Central Pacific — analog-year monthly formation trends. (No AI statistical forecast is available for this basin.)
Note on the WNI AI Statistical Forecast: The WNI proprietary AI statistical forecast is generated by a machine-learning model trained on historical tropical convective activity. It is shown alongside analog-year trends — years with sea surface temperature anomalies and atmospheric circulation in the El Niño monitoring region (NOAA) and the Indian Ocean similar to this year's forecast (2023, 2018, 2015, 2009, 2002, and 1997). All values are compiled by WNI based on NOAA statistics; monthly averages may not sum to totals due to rounding.
Storm Tracks and Risk Areas
1. North Atlantic
Risk is concentrated along the US East Coast in July, with a notable broadening in September, when elevated risk extends across the entire basin — including the Gulf of Mexico and the Caribbean Sea. Compared to normal, July risk runs above average near the US East Coast, while September's risk areas tend to shift eastward and October's risk eases around the Caribbean.
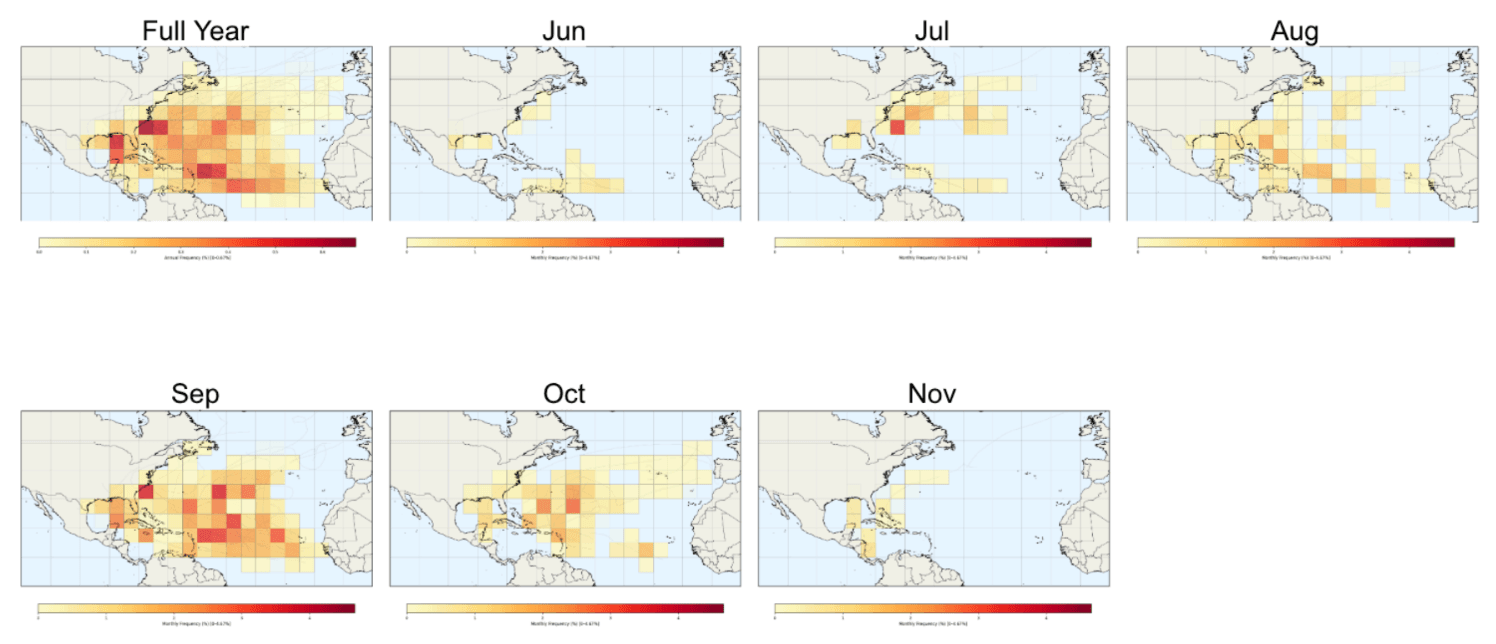
Figure 1-1: Annual and monthly (Jun–Nov) TS/hurricane track density for the North Atlantic, based on analog years. Darker colors indicate areas of higher track density. Compiled by WNI using NOAA HURDAT2 data.
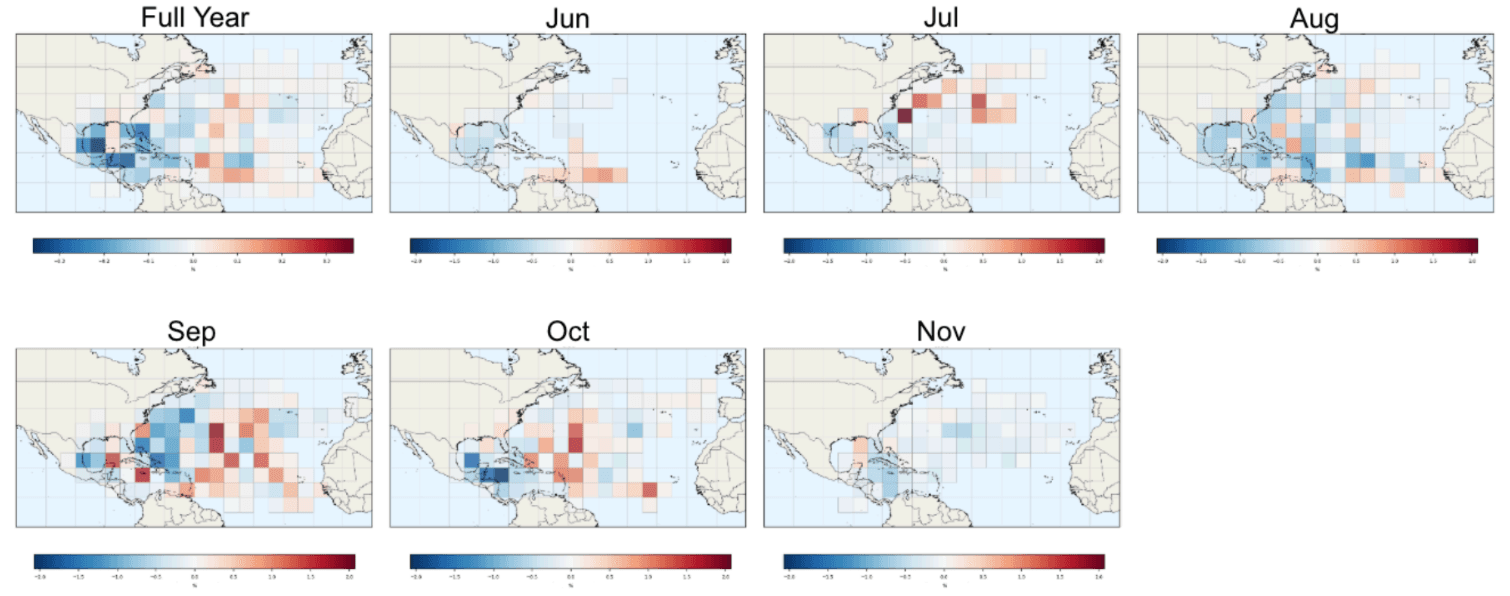
Figure 1-2: Annual and monthly (Jun–Nov) TS/hurricane track density anomalies for the North Atlantic, based on analog years. Warm (cool) colors indicate higher (lower) density compared to normal. Compiled by WNI using NOAA HURDAT2 data.
2. Northeast & Central Pacific
Risk stays elevated off the coast of Mexico throughout the season, with a clear tendency for higher Central Pacific risk from July to October. Through August and September, the elevated-risk band stretches from off Mexico toward Hawaii. Relative to normal, risk off Mexico runs above average in June, October, and November but below average from July to September, while the Central Pacific trends above normal from August to October — and the overall risk pattern shifts westward in late summer.
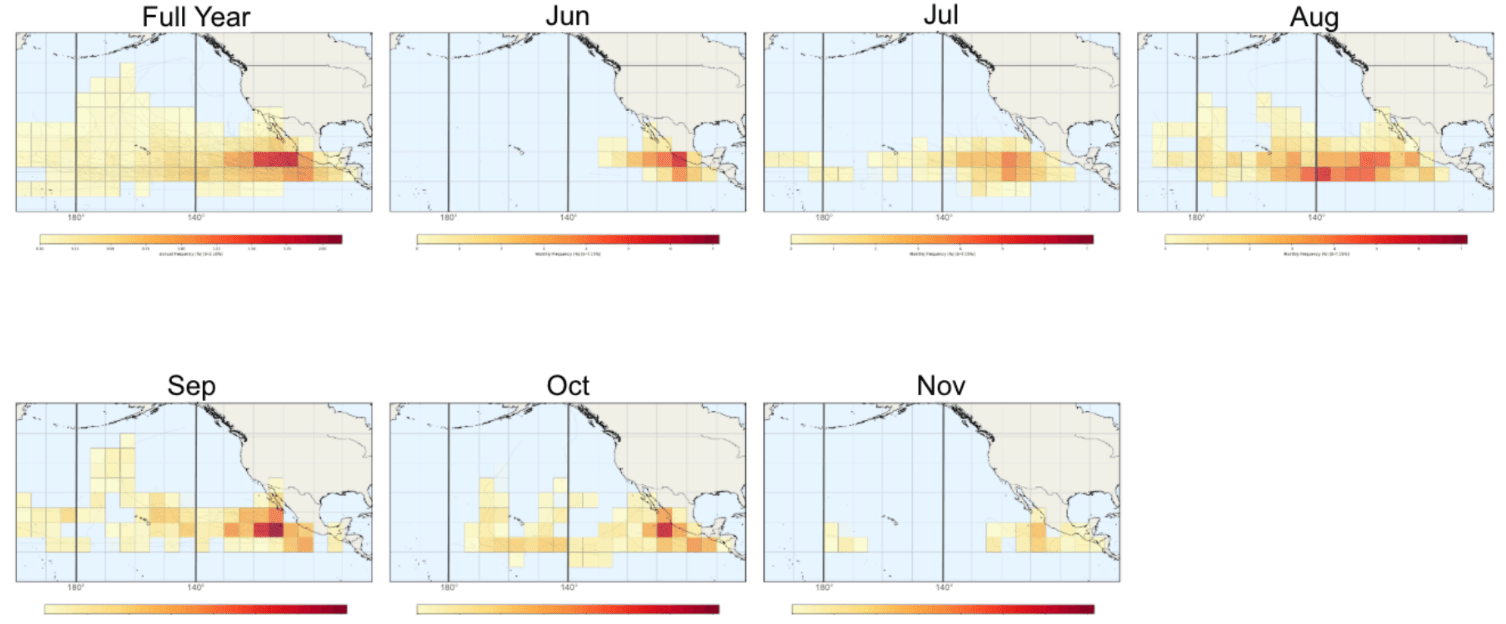
Figure 2-1: Annual and monthly (Jun–Nov) TS/hurricane track density for the Northeast and Central Pacific, based on analog years. Darker colors indicate areas of higher track density. Compiled by WNI using NOAA HURDAT2 data.
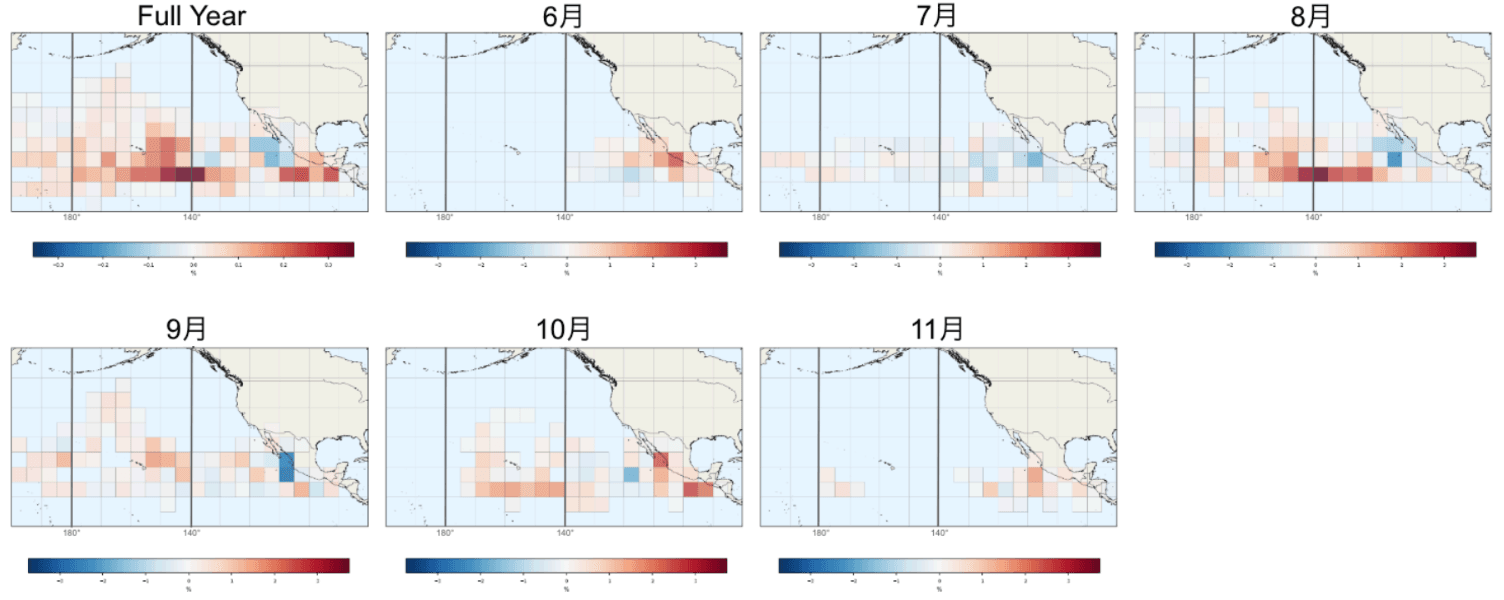
Figure 2-2: Annual and monthly (Jun–Nov) TS/hurricane track density anomalies for the Northeast and Central Pacific, based on analog years. Warm (cool) colors indicate higher (lower) density compared to normal. Compiled by WNI using NOAA HURDAT2 data.
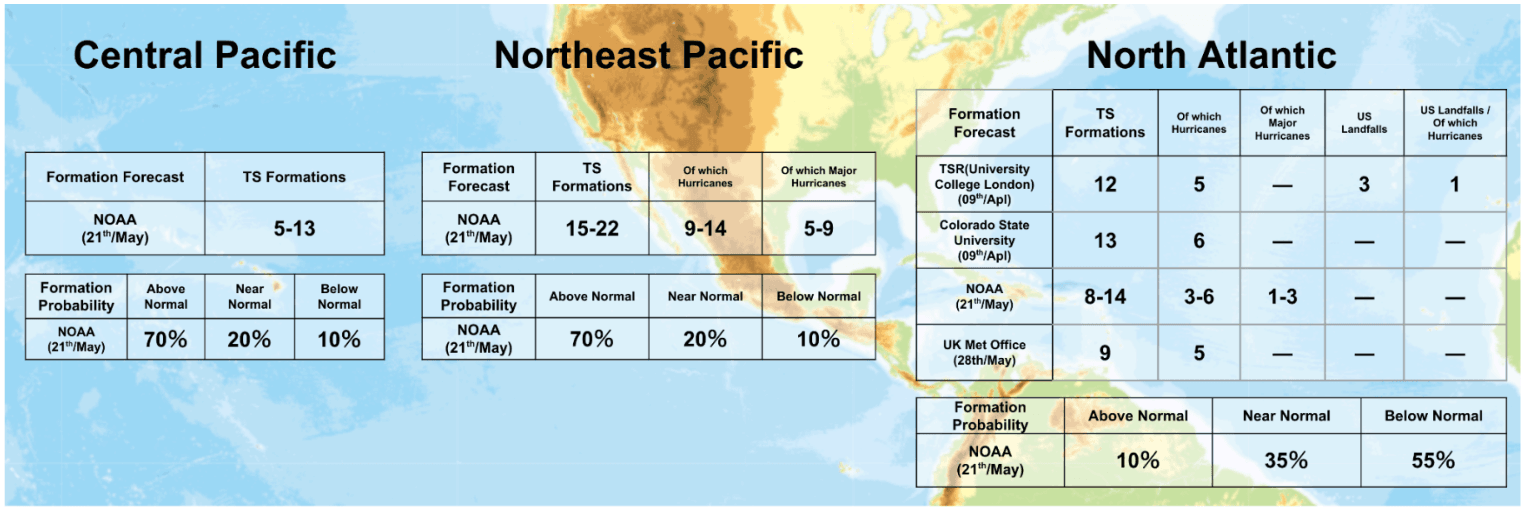
Forecasts from Each Organization
Comparison of 2026 North Atlantic / Northeast Pacific tropical storm & hurricane seasonal forecasts issued by major forecasting organizations.
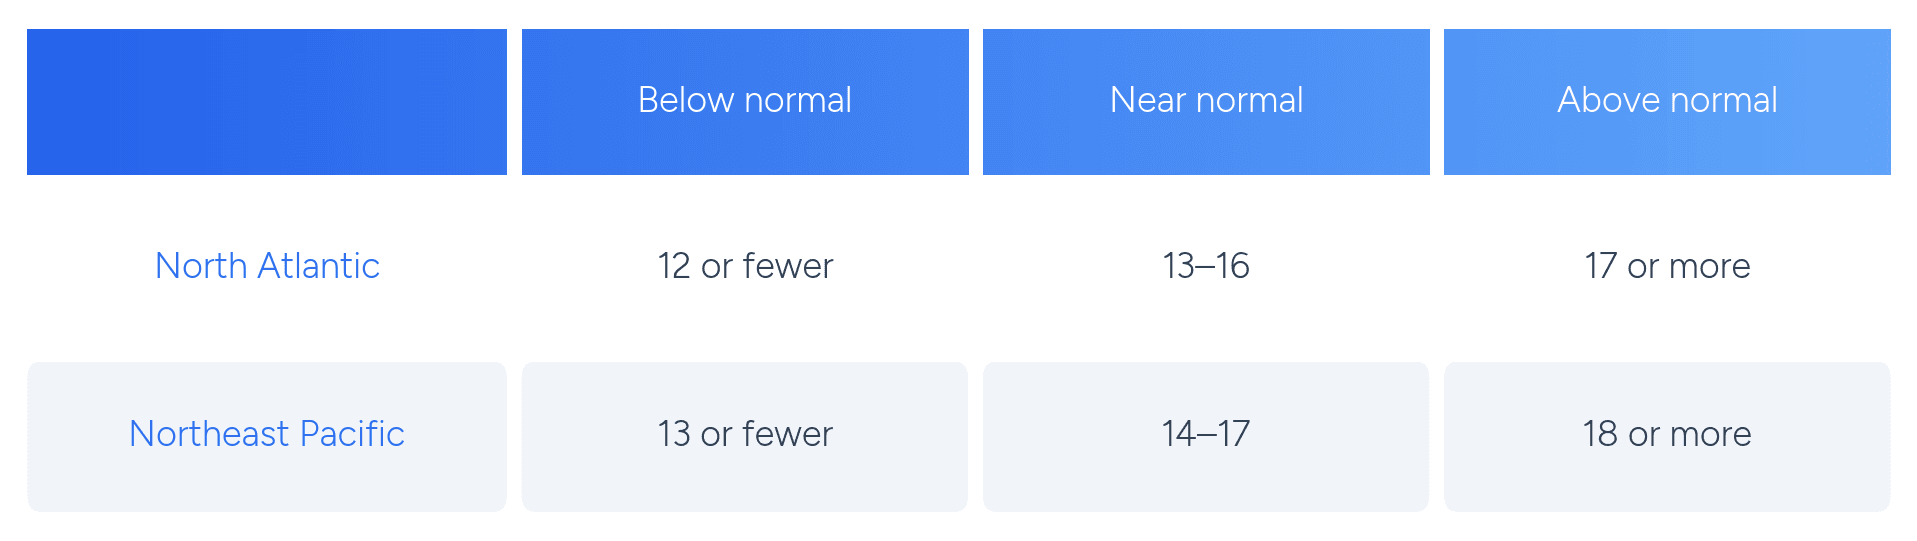
Weathernews activity classifications by basin. The Central Pacific is not assigned a seasonal category. Normals based on the 1991–2020 climatology.
How We Classify Seasonal Activity
Throughout this outlook, activity is described as below, near, or above normal. These labels follow Weathernews' own classification, based on the total number of tropical storms and hurricanes expected across a season. The thresholds differ slightly between basins, as shown below.