
Storm Trend Outlook
North Atlantic and North Pacific Storm Trend Outlook (December 2024 – February 2025)
Weathernews' expert meteorologists have analyzed pressure patterns across the North Atlantic and North Pacific regions, providing critical insights into expected storm activity for the coming months. These forecasts aim to inform operators about potential weather challenges during this winter season.
1. North Atlantic Storm Trend Outlook
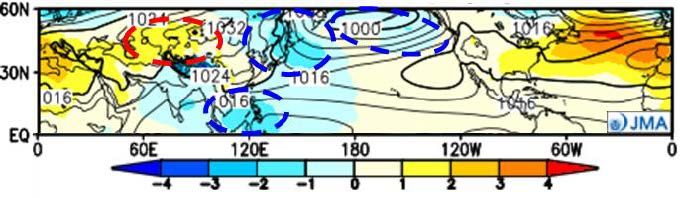
December 2024
- High pressure dominates the central Atlantic.
- Low-pressure systems frequently develop across the northern Atlantic & North Sea.
- The Mediterranean Sea experiences reduced storm activity due to persistent high pressure.
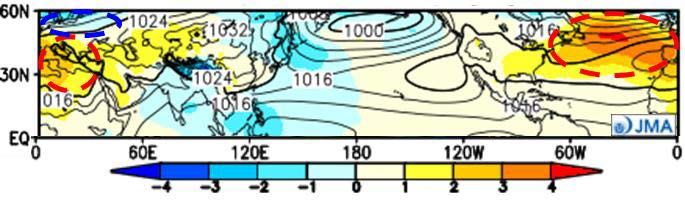
- Fig.1 Monthly sea level pressure anomaly simulation for Dec. 2024 (JMA)
- ※Yellow indicates higher pressure, and blue indicates lower pressure compared with the normal year. Unit: hPa
Industry Insights: Storm activity in the Mediterranean is expected to decrease compared to normal years, while the northern Atlantic is forecast to experience more frequent low-pressure systems than usual.
January 2025
- High pressure strengthens in the central Atlantic.
- Low-pressure systems frequently develop in the eastern Atlantic, affecting Eastern North America & Europe.
- Mediterranean storm activity aligns with typical seasonal patterns.
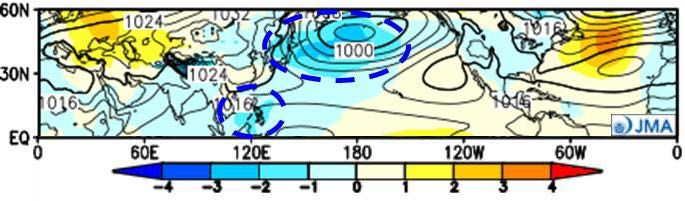
- Fig.2 Monthly sea level pressure anomaly simulation for Jan. 2025 (JMA)
- Unit: hPa
Industry Insights: Storm activity in Eastern North America and Europe is forecast to increase compared to average conditions, while the Mediterranean remains consistent with normal trends.
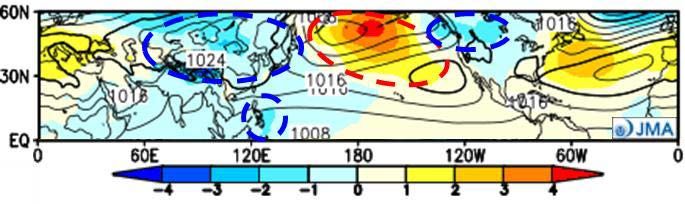
February 2025
- High pressure persists in the central Atlantic.
- Low-pressure activity in northern Atlantic regions leads to more frequent severe conditions.
- Reduced storm activity is forecast for the Mediterranean
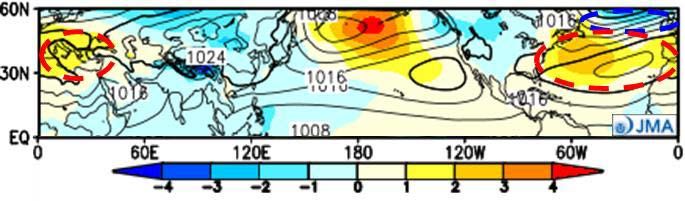
- Fig. 3 Monthly sea level pressure anomaly simulation for Feb. 2025 (JMA)
- Unit: hPa
Industry Insights: Severe conditions are expected to occur more frequently in the northern Atlantic than normal, while the Mediterranean will likely see calmer weather.
Normal Year Conditions in North Atlantic
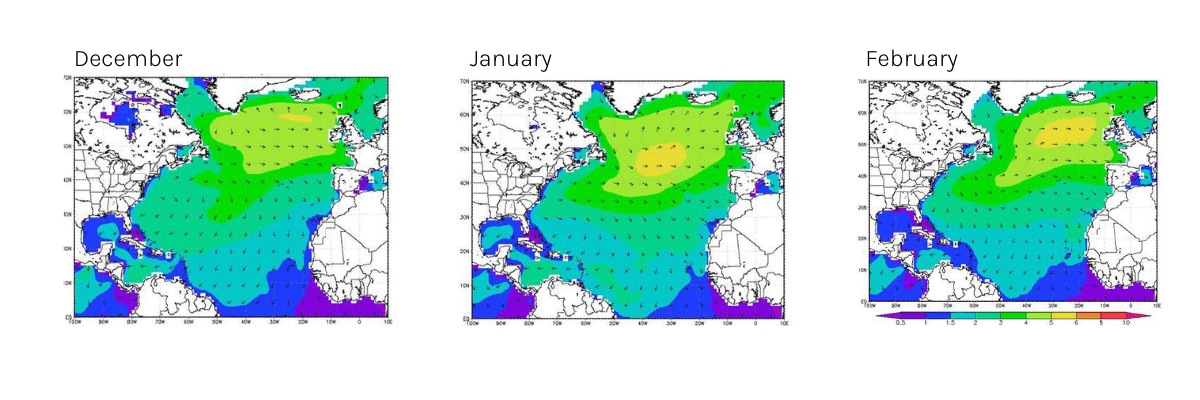
- Fig.4 The mean significant wave height of the past five years (WNI analysis)
- Unit: m
- (Left) December, 2019-2023
- (Center) January, 2020-2024
- (Right) February, 2020-2024
2. North Pacific Storm Trend Outlook
December 2024
- Low-pressure conditions dominate from Japan to the Gulf of Alaska, increasing storm activity near the Kuril Islands & Northeastern Pacific.
- High pressure over China strengthens the Northeast monsoon in the East & South China Seas.
- Fig. 1 Monthly sea level pressure anomaly simulation for Dec. 2024 (JMA)
- ※Yellow indicates higher pressure, and blue indicates lower pressure compared with the normal year. Unit: hPa
Industry Insights: Storm activity around the Kuril Islands and Northeastern Pacific is expected to increase compared to normal years. The Northeast monsoon winds will also be stronger than usual.
January 2025
- Low-pressure systems frequently develop in the western & central Pacific, increasing storm activity near the Aleutian Islands.
- Northeast monsoon winds in the East and South China Seas are slightly above average.
- Fig. 2 Monthly sea level pressure anomaly simulation for Jan. 2025 (JMA)
- Unit: hPa
Industry Insights: Storm activity near the Aleutian Islands is expected to exceed normal levels, and monsoon conditions will be slightly stronger than average.
February 2025
- Low-pressure systems near Japan and western Canada increase storm activity in the Western Pacific & Northwestern North America.
- Monsoon activity in the South China Sea aligns with typical seasonal patterns.
- Fig. 3 Monthly sea level pressure anomaly simulation for Feb. 2025 (JMA)
- Unit: hPa
Industry Insights: More frequent storms than normal are forecast for the Western Pacific & Northwestern North America. The South China Sea is expected to align with average February conditions.
Normal Year Conditions in North Pacific
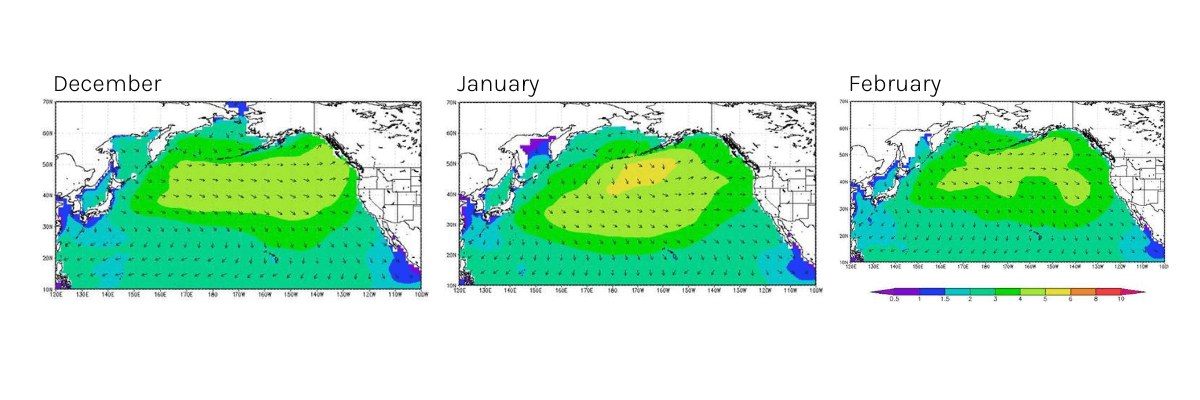
- Fig.4 The mean significant wave height of the past five years (WNI analysis)
- Unit: m
- (Left) December, 2019-2023
- (Center) January, 2020-2024
- (Right) February, 2020-2024