
Storm Trend Outlook
New Storm Trend Outlook – February to April 2025 (North Pacific & North Atlantic)
At Weathernews, we regularly update our storm trend forecasts to keep you informed. Our latest Storm Trend Outlook for February through April 2025 covers key developments across the North Pacific and North Atlantic regions.
1. North Pacific Storm Trends
February 2025
- Higher-than-normal atmospheric pressure develops in the central to eastern North Pacific.
- Low-pressure systems form near Japan and move toward the Bering Sea.
- The northeast monsoon in the East China Sea and South China Sea remains at normal levels or weaker.
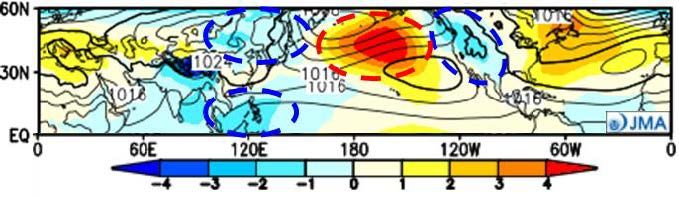
- Monthly sea level pressure anomaly simulation for Feb. 2025 (JMA)
- ※Yellow indicates higher pressure, and blue indicates lower pressure compared with the normal year. Unit: hPa
Industry Insights: Storm systems are expected to track from Japan to the Bering Sea, while monsoonal winds in East Asia stay at or below normal intensity.
March 2025
- Higher-than-normal atmospheric pressure persists in the central to eastern North Pacific.
- Low-pressure systems intensify near Japan and shift toward the Kamchatka Peninsula.
- The northeast monsoon in East Asian waters remains normal or weaker than usual.
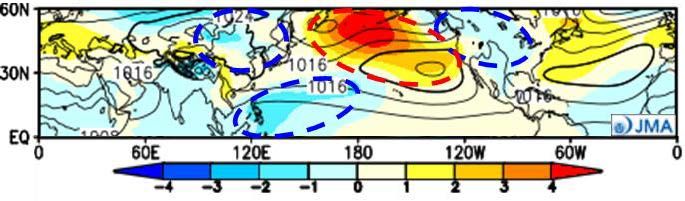
- Fig.2 Monthly sea level pressure anomaly simulation for Mar. 2025 (JMA)
- Unit: hPa
Industry Insights: Storms will track farther north toward Kamchatka, while calmer conditions persist in the East China and South China Seas.
April 2025
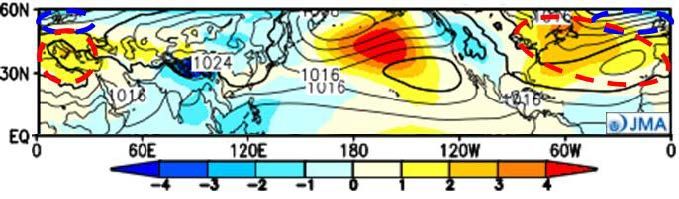
- High pressure dominates the central North Pacific, with lower pressure in Far East Russia and North America.
- Stormy conditions increase around Japan and the western U.S. coastline.
- The northeast monsoon in the East China Sea and South China Sea remains at or below normal strength.

- Fig. 3 Monthly sea level pressure anomaly simulation for Apr. 2025 (JMA)
- Unit: hPa
Industry Insights: Expect increased storm activity near Japan and along the U.S. West Coast, with weaker-than-usual monsoonal winds in East Asia.
Normal Year Conditions in North Pacific
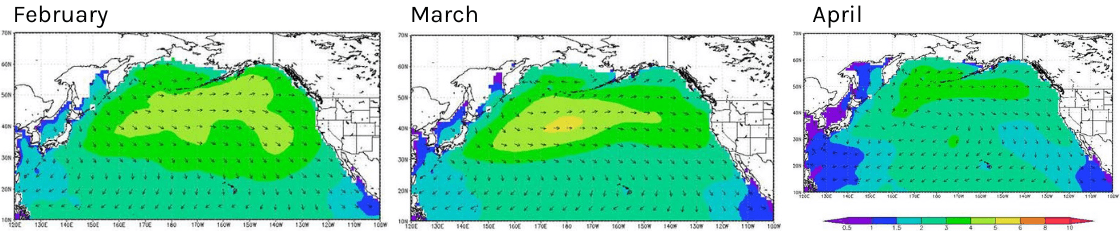
- Fig.4 The mean significant wave height of the past five years (WNI analysis)
- Unit: m
- (Left) February, 2020-2024
- (Center) March, 2020-2024
- (Right) April, 2020-2024
2. North Atlantic Storm Trend Outlook
February 2025
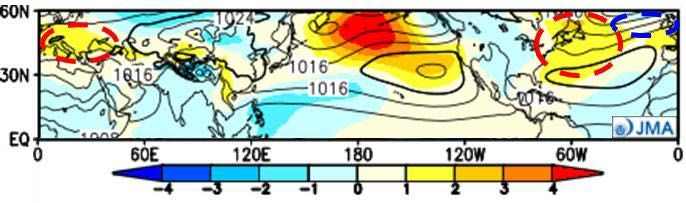
- Higher-than-normal pressure builds from the U.S. East Coast to the Azores, strengthening the Azores High.
- Low-pressure systems develop in the high latitudes of the North Atlantic and near Europe.
- The Mediterranean sees calmer conditions with above-normal atmospheric pressure.
- Fig. 1 Monthly sea level pressure anomaly simulation for Feb. 2025 (JMA)
- ※Yellow indicates higher pressure, and blue indicates lower pressure compared with the normal year. Unit: hPa
Industry Insights: The Azores High strengthens, leading to increased storm activity in the North Atlantic, while the Mediterranean remains relatively stable.
March 2025
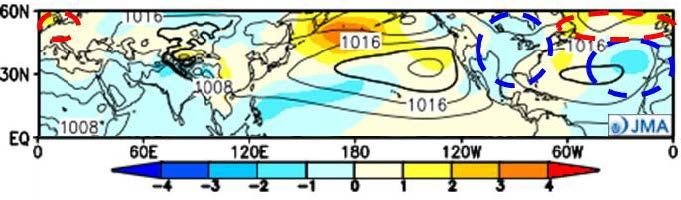
- The Azores High weakens slightly, while lower pressure dominates the high-latitude North Atlantic.
- Storm activity increases in the northern Atlantic, bringing more unsettled conditions.
- The Mediterranean remains drier than usual due to higher-than-normal atmospheric pressure.
- Fig. 2 Monthly sea level pressure anomaly simulation for Mar. 2025 (JMA)
- Unit: hPa
Industry Insights: A shift in pressure patterns will bring more stormy conditions to the North Atlantic, while the Mediterranean continues to experience calmer weather.
April 2025
- The Azores High weakens further, allowing lower pressure to develop over the eastern North Atlantic.
- Storm activity increases along the U.S. East Coast and the eastern North Atlantic.
- The Mediterranean returns to normal atmospheric pressure, leading to average storm conditions.
- Fig. 3 Monthly sea level pressure anomaly simulation for Apr. 2025 (JMA)
- Unit: hPa
Industry Insights: A weaker Azores High will allow for more storms along the U.S. East Coast and the eastern Atlantic, while the Mediterranean sees normal storm levels.
Normal Year Conditions in North Atlantic
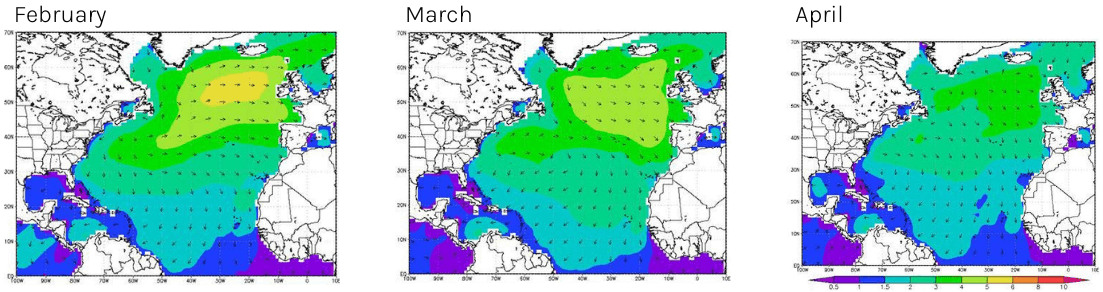
- Fig.4 The mean significant wave height of the past five years (WNI analysis)
- Unit: m
- (Left) February, 2020-2024
- (Center) March, 2020-2024
- (Right) April, 2020-2024