

Houthi forces have announced a blockade on Saudi Arabia, straining a second critical chokepoint even as the Strait of Hormuz has yet to fully normalize. Announced on July 20, its target is the Strait of Bab el-Mandeb - the southern gateway to the Red Sea - squeezing a corridor carrying roughly 7% of global oil supply.
Bab el-Mandeb's share is smaller than Hormuz's 20% of global oil trade, but its significance lies in its role as the intended workaround. Yanbu Port, for example, saw traffic climb from 660 to 990 vessels during the March Hormuz disruption, while Cape of Good Hope routings rose 20%.
However, since the announcement on July 20, the situation has shifted. AIS data shows tanker activity at Yanbu averaged 23 vessels per day at berth or anchor in the first nineteen days of July — a figure that fell to 7 by July 24 and effectively collapsed to near-zero by July 25, consistent with a likely shift to AIS-dark operations. Vortexa data cited by Windward places the corresponding volume impact at roughly 40%, from 5.16 to 3.09 million barrels per day.
The same infrastructure built to bypass one chokepoint is now exposed to the next.
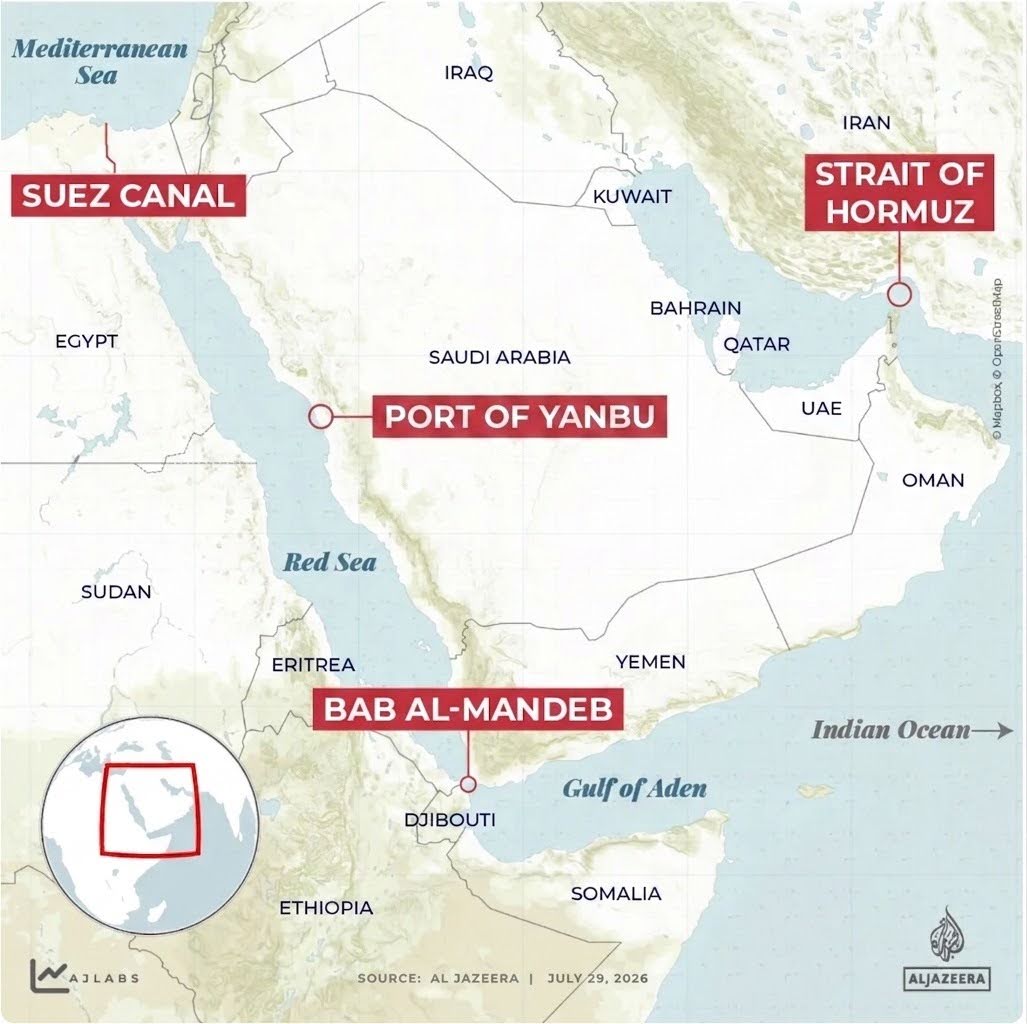
Image from Al Jazeera / AJLabs (Modified by Weathernews Inc. to include the Port of Yanbu)
What the Data Reveals: Traffic Contraction Through Bab el-Mandeb
Tracking AIS data shows a contraction in shipping traffic through the Bab el-Mandeb Strait following the blockade announcement.
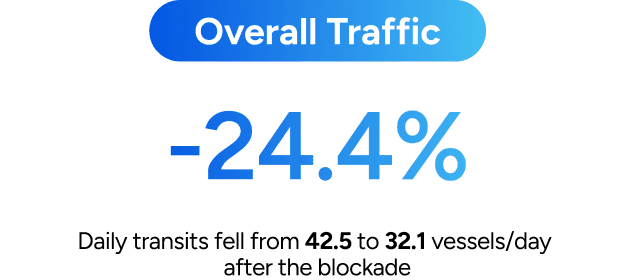
Between July 1 and July 19, an average of 42.5 vessels per day were recorded crossing the strait's midline (12.58°N) in either direction. In the nine days that followed the announcement, from July 20 to July 28, that figure fell to 32.1 vessels per day—a decline of approximately 24%.
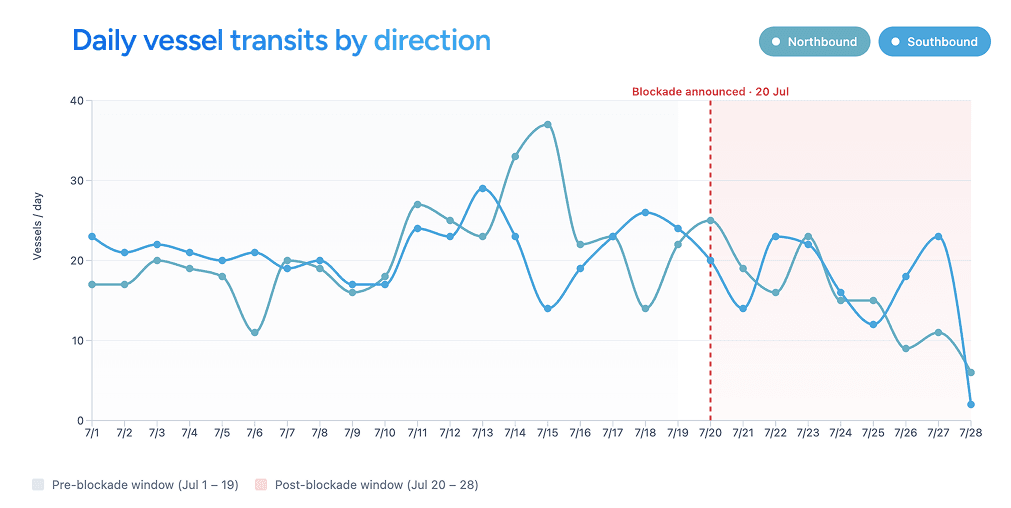
The pullback was broadly symmetric across direction of travel: northbound transits into the Red Sea dropped from 21.1 to 15.4 vessels per day on average (−26.8%), while southbound transits out of the Red Sea fell from 21.4 to 16.7 vessels per day on average (−22.0%), reflecting the downward trend as seen in the graph below.
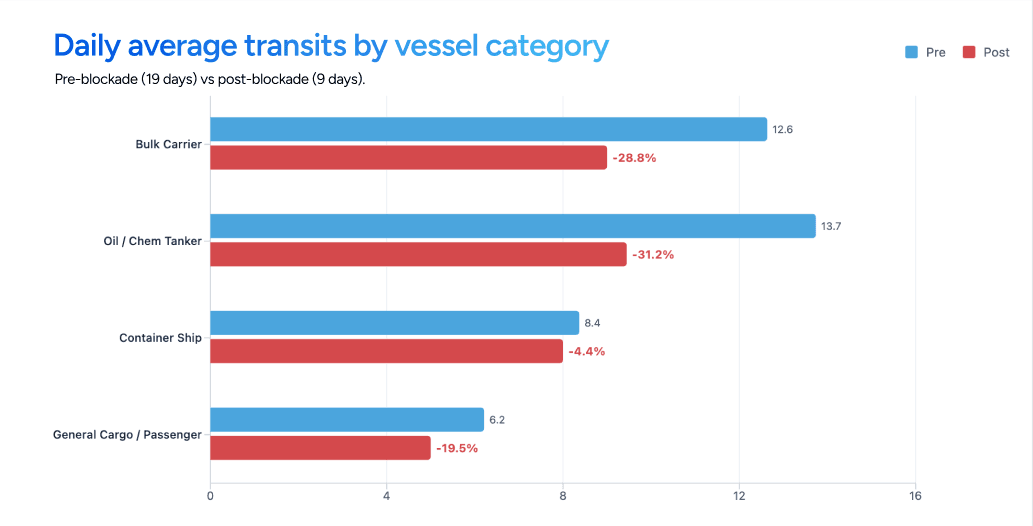
The decline was not evenly distributed across vessel categories. Oil and chemical tankers recorded the steepest pullback among the major segments, falling from an average of 13.7 to 9.4 transits per day — a decline of roughly 31%. Bulk carriers fell comparably, from 12.6 to 9.0 per day (−28.8%). Container ships, by contrast, barely moved — from 8.4 to 8.0 per day (−4.4%). General cargo and passenger vessels declined moderately (6.2 to 5.0 per day, −19.5%).
It should be noted that these figures reflect vessels that completed a transit of the strait midline during each window; ships that approached the strait area and turned back without crossing are not counted, and any vessels that switched off their AIS transponders after the announcement would not appear in the dataset.
Data & credits: AIS source data from MarineTraffic by Kpler, analyzed by Weathernews. Vessel type classifications cross-referenced against Lloyd's List Intelligence.
Operational Weather Risks in the Red Sea
Beyond the geopolitical picture, vessels in the Red Sea face a compounding set of seasonal weather stressors.
- Southwest Monsoon
The Bab el-Mandeb entrance sits in the path of the summer southwest monsoon, which peaks June–August. Although Weathernews' 2026 monsoon outlook forecasts a weaker season overall due to developing El Niño conditions, operational impact remains material.
Our latest Indian Ocean weekly report shows southwesterly monsoon winds prevailing across the Arabian Sea at 20–25 kt in the first half of the week. Notably, our forecasters flag an intensification toward the end of the week, with conditions strengthening to 25–30 kt and significant wave heights reaching 4–5 m across the central and northern Arabian Sea from July 30 onward.
For vessels that may be loitering, slow-steaming, or waiting for convoy windows in response to the blockade, the monsoon narrows the operational envelope, particularly for smaller tankers and general cargo carriers with lower freeboard.
- Sea Surface Temperatures
The same El Niño damping the monsoon is also tracking toward the strongest event on record. In the Red Sea itself, current SSTs from Weathernews' SeaNavigator platform show surface temperatures of 30°C across the northern basin near Yanbu and Jeddah, rising to 35°C toward the southern Red Sea and Bab el-Mandeb approaches.
For maritime operations these levels reduce seawater engine-cooling efficiency, elevate stress on temperature-sensitive cargo, and raise habitability concerns for crews on vessels held at extended anchorage.
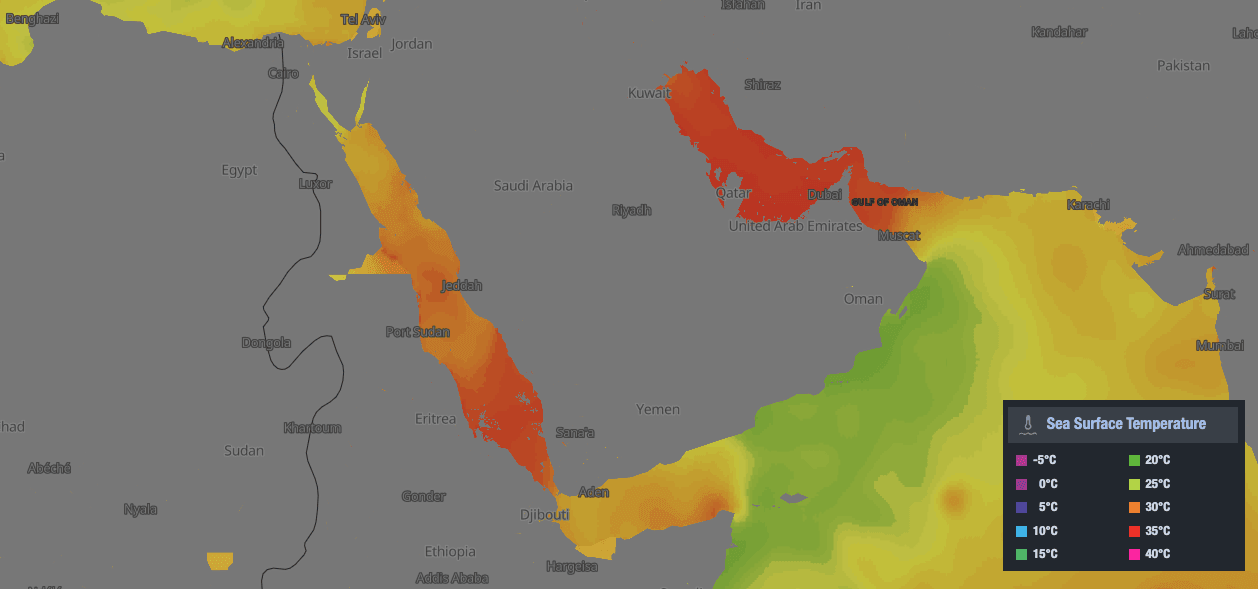
Red Sea surface temperatures, 29 July 2026. Source: Weathernews SeaNavigator platform.